

Spot gold extended losses on Wednesday (Oct 7), falling nearly 1.6% and dipping to $4066.26 per ounce before rebounding to around $4111. The US dollar and Treasury yields strengthened again after a minor pullback in the prior session, pushing gold below the $4100 threshold. Markets are awaiting the release of the Fed’s September meeting minutes for clues on whether additional rate hikes will occur this year.
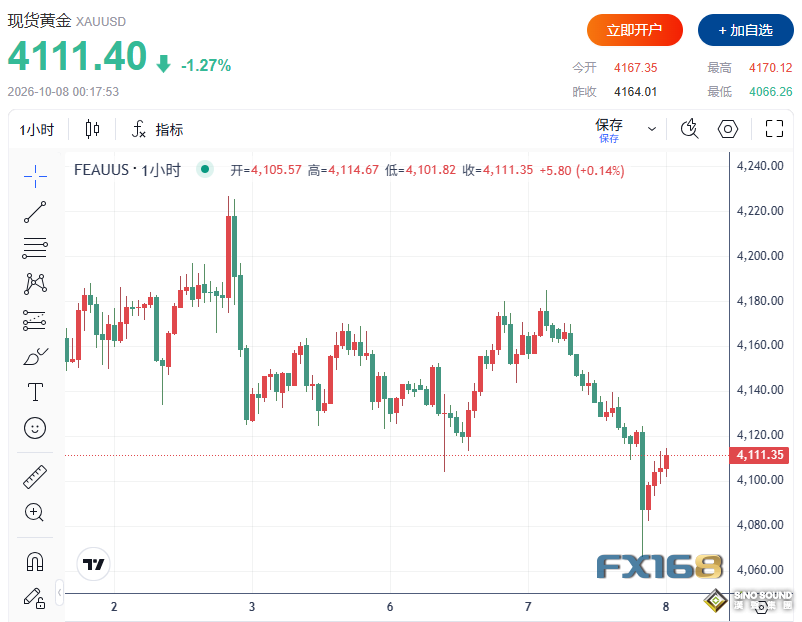
(Source: FX168)
Gold Faces Dual Pressure from Strengthening Dollar and Treasury Yields
The US Dollar Index (DXY) climbed to near 102.36, close to highs seen since April 2025. The yield on the US 10-year Treasury briefly surged to 5.365%, the highest level since 2002, before retreating to roughly 5.31%.
Rising energy inflation risks stemming from Middle East conflicts, worries over mounting government debt and fiscal deficits, and expectations of resilient US economic growth have combined to drive borrowing costs higher.

Higher Treasury yields raise the opportunity cost of holding non-interest-bearing assets such as gold and boost the appeal of dollar-denominated assets. A stronger dollar also makes gold more expensive for buyers using other currencies. These two forces together keep weighing on gold prices.
Earlier, tensions in the Middle East had lifted safe-haven demand for gold, yet climbing energy prices reinforced expectations of inflation and monetary tightening. Gold is now more than 25% below its all-time high near $5600 hit in January, showing that rate pressures remain the dominant driver of its near-term trend.
Expectations for a Rate Pause in October Rise, Tightening Still Possible in December
Recent US employment and personal consumption expenditures (PCE) inflation data came in weaker than forecast, prompting traders to reassess the Fed’s policy path.
Markets widely expect the Federal Reserve to hold interest rates steady at its October 27–28 meeting after the 25-bASIs-point hike in September. Still, peRSIstent inflation risks from high energy prices leave the door open for another rate increase in December.
The Fed’s September meeting minutes will be released at 2:00 AM Beijing time on Thursday. Investors will focus on policymakers’ judgments about inflation peRSIstence, cooling employment, and the need for further policy tightening.
If the minutes reinforce expectations of another rate hike within the year, the dollar and Treasury yields may continue to find support, adding downside pressure to gold. If the wording shows policymakers are more cautious about growth or employment, gold may get some breathing room.
Central Bank Gold Buying Continues; China Boosts Reserves for 22 Straight Months
Despite short-term headwinds, central bank demand offers long-term support for gold. Analysts at ING cited World Gold Council data showing global central banks made net gold purchases of 39 tonnes in August, bringing total buying for the year to 170 tonnes.
The People’s Bank of China led purchases for the month with a 20-tonne addition, extending its consecutive buying streak to 22 months. Poland and Uzbekistan each added 8 tonnes over the same period.
Sustained gold purchases reflect the metal’s important role in central bank reserve diveRSIfication. Nevertheless, such long-term allocation demand is not enough to offset short-term pressure from a stronger dollar and rising Treasury yields.
Technicals Remain Bearish; $4100 Becomes a Key Near-Term Battlefield
Daily charts show gold is testing the lower bound of its prior consolidation range of $4100–$4200 and has briefly fallen beneath it. Gold remains well below the 100-day simple moving average near $4267 and the 200-day SMA around $4530, keeping the overall technical structure bearish.
Momentum indicators are also weak. The Relative Strength Index (RSI) stands near 38 and has not yet entered oversold territory. MACD remains in negative territory, though its red histogram bars are shrinking, indicating weakening bearish momentum — not enough to confirm a trend reversal.
On the downside, reclaiming and holding the $4100 round level is an important signal for judging the near-term trend. If gold stays below this mark, it may fall further to test the year-to-date lows in the $4000–$3950 zone.
Initial resistance on the upside sits at $4200, followed by the 100-day SMA near $4267. If the rebound extends further, the $4400 resistance level will come into view, while the 200-day SMA near $4530 remains a major hurdle for bulls.
While central bank gold buying provides long-term backing, gold’s ability to stabilise in the short run still hinges on movements in the dollar and Treasury yields, and whether the Fed minutes can ease market fears of further policy tightening.