

After rising in the first two trading days of the week, spot gold tumbled to a two-month low on Wednesday (Oct 7). A stronger US dollar and surging US Treasury yields weighed on the non-yielding precious metal. FXStreet analyst Christian Borjon Valencia published a fresh article analysing gold price movements.
Valencia wrote that gold came under pressure on Wednesday as the FOMC meeting minutes hinted at further Fed rate hikes, and the price briefly broke below the $4100 per ounce mark.
Spot gold closed down $53.26, or 1.28%, at $4110.75 per ounce on Wednesday.
The US Dollar Index climbed 0.4%, making dollar-denominated gold more expensive for holders of other currencies, while the yield on the US 10-year Treasury stood at a more than 20-year high.

The US 10-year Treasury yield briefly hit 5.365%, a 24-year high, before retreating to 5.27%. The pullback in Treasury yields helped gold bounce off its intraday low.
Fed Meeting Minutes Hint at Additional Rate Hikes
Fed policymakers were divided over the rationale for raising rates last month. The September meeting minutes showed that “some participants” saw a need for a rate increase to curb the effects of energy and other price shocks, while core hawkish officials argued a hike was necessary to guard against the emergence of demand-driven inflation.
The minutes noted that “many participants” viewed the rate hike as an “insurance measure” against inflation staying peRSIstently above target. Other members said the decision aimed to prevent inflation from spreading to other price categories, while a “few” members stated the hike was to adapt to a higher-than-expected neutral interest rate. Notably, the minutes showed Fed officials judged that another rate hike would be “appropriate” before year-end.
Markets widely expect the Fed to keep rates unchanged later this month, though CME FedWatch pricing still puts the odds of a December rate hike at 85%.
Peter Grant, Vice President and Senior Metals Strategist at Zaner Metals, said: “I think the Fed’s message is that rates will stay higher for longer, which underpins Treasury yields and the US dollar.”
Two Fed officials delivered speeches on Tuesday. Kansas City Fed President Schmid said further rate hikes are needed to contain high inflation, while San Francisco Fed President Daly noted additional policy adjustments would depend on data and the impact of external shocks.
China’s central bank accelerated gold purchases in September. Official data shows China has increased its gold holdings for the 23rd consecutive month.
Grant added: “Official gold demand is the main supporting factor. I think gold may retest lower levels once more, possibly down to $4000 per ounce, then rebound before year-end with potential to reach $4400 per ounce.”
Gold Technical Analysis
#GoldTechnicalAnalysis# FXStreet analyst Christian Borjon Valencia pointed out that gold’s downtrend faces critical support at $4100 per ounce. So far, sellers have failed to decisively push prices further down toward the $4000 per ounce level. Even so, the overall pattern suggests gold will remain weak in the short term; price action forms lower highs and lower lows, and the Relative Strength Index (RSI) indicates bearish momentum peRSIsts.
Valencia said for a rebound to materialise, gold must break above $4200 per ounce, then challenge key resistance at the 100-day and 50-day Simple Moving Averages (SMA), located at $4267 and $4331 per ounce respectively.
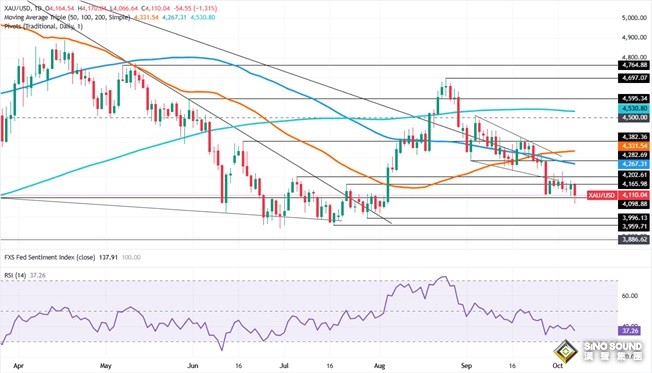
(Spot Gold Daily Chart Source: FXStreet)
Valencia added that conversely, the path of least resistance for gold is a breakdown below $4100 per ounce, which would trigger a test of the July 29 swing low of $3996 per ounce and then the year-to-date low of $3941 per ounce.