

Tuesday (September 29), spot gold staged a strong rebound after the sharp sell-off in the previous trading session, moving away from its seven-week low. FXStreet analyst Christian Borjon Valencia released a new article analysing gold price movements.
Spot gold closed sharply higher by $67.27, or 1.64%, at $4182.15 per ounce on Tuesday; in the prior session, gold had plummeted by nearly 4%.
Valencia pointed out that gold rebounded sharply from the intraday low near $4110 per ounce on Tuesday as the plunge in oil prices eased inflationary pressure. WTI crude oil fell below $90 per barrel.
(Screenshot source: FXStreet)
Collapsing Oil Prices Offset Strength in the US Dollar and Treasury Yields, Fueling Gold’s Strong Rebound

Valencia said the recovery in gold prices was mainly attributable to falling energy prices. West Texas Intermediate (WTI), the US crude benchmark, tumbled 4.27% to settle at $89.10 per barrel during Tuesday’s trading session. Even though US Treasury yields and the US dollar remained elevated, the slump in oil prices eased inflation pressures.
The 10-year US Treasury yield rose 2 bASIs points to 5.255% on Tuesday, near levels last seen in 2004. The US Dollar Index (DXY), which tracks the greenback against six currencies, climbed 0.20% to 101.37.
Valencia stated that a stronger US dollar normally raises gold’s purchASIng cost for overseas buyers, yet falling energy prices offered support for bullion.
Technical Correction
Other analysts noted that Tuesday’s sharp rebound in gold represented a technical correction following the prior day’s massive drop.
Peter Grant, Vice President and Senior Metals Strategist at Zaner Metals, commented: “Tuesday’s gold move is just a correction of yesterday’s decline. I still think gold faces some pretty heavy resistance.”
Gold fell nearly 4% on Monday, marking its largest single-day drop since June 10 and hitting the lowest level since August 5.
Grant added: “Rising market expectations for further Fed rate hikes keep the US dollar strong and Treasury yields high. I believe gold’s upside room may be rather limited. Markets will keep a close eye on Wednesday’s PCE inflation data and Friday’s non-farm payrolls report.”
A stronger US dollar makes dollar-denominated gold more expensive for foreign buyers, while higher Treasury yields lift the opportunity cost of holding non-interest-bearing gold.
Gold is traditionally viewed as an inflation hedge, yet its appeal versus yield-bearing assets usually weakens in a high-rate environment.
Investors are awaiting key US economic indicators including ADP employment figures, Wednesday’s Personal Consumption Expenditures (PCE) data, and Friday’s non-farm payrolls report.
Gold Technical Analysis: Gold Rallies but Faces Strong Resistance Near $4200
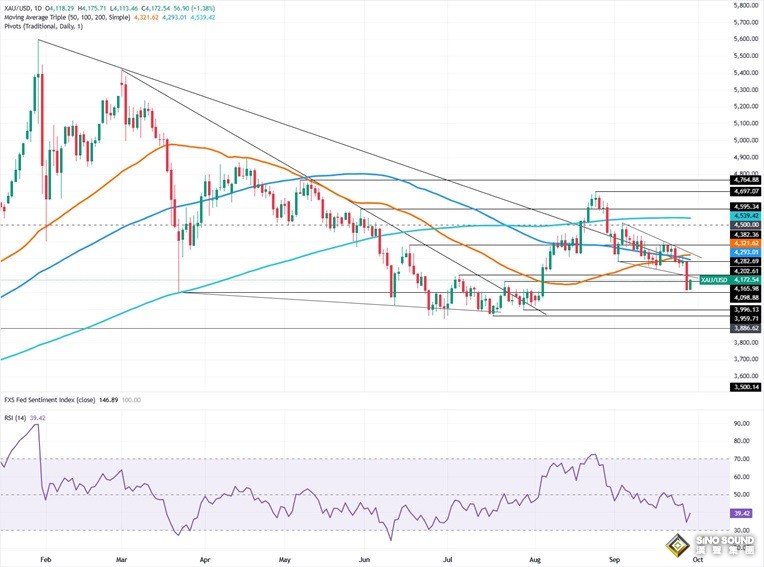
FXStreet analyst Christian Borjon Valencia said gold is attempting to move higher after bottoming out near $4100 per ounce and is about to test the lower trendline of a bullish wedge formation. A break above this resistance may open the door for gold to retest the $4200 per ounce level.
Even so, market momentum remains tilted to the downside, confirmed by the Relative Strength Index (RSI) staying below the neutral level of 50. This indicates gold’s trend is still bearish for now.
Valencia said gold’s primary support lies at the September 28 swing low of $4110 per ounce. If this level breaks, subsequent support levels are $4100 per ounce and the psychological threshold of $4000 per ounce. The next support zone sits at $3996 per ounce (the intraday low on July 29), followed by the yearly low of $3941 per ounce.
(Spot Gold Daily Chart Source: FXStreet)