

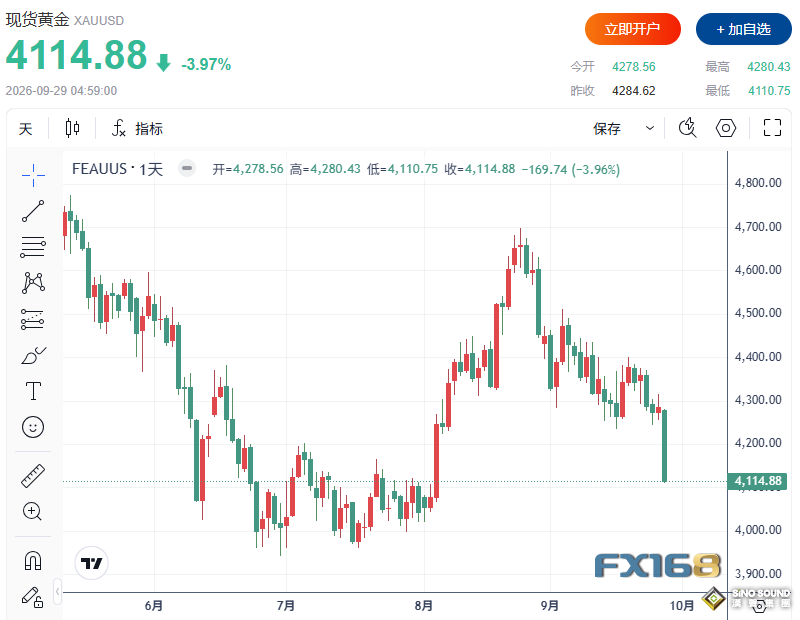
During Monday’s New York session, spot gold and spot silver both tumbled. After the market repriced the risk premium for the Strait of Hormuz, oil prices climbed and U.S. Treasury yields moved higher, further boosting expectations of another Federal Reserve rate hike. At the close, spot gold settled at $4114.88 per ounce, down nearly $170 on the day, representing a drop of 3.97%.
(Source: FX168)
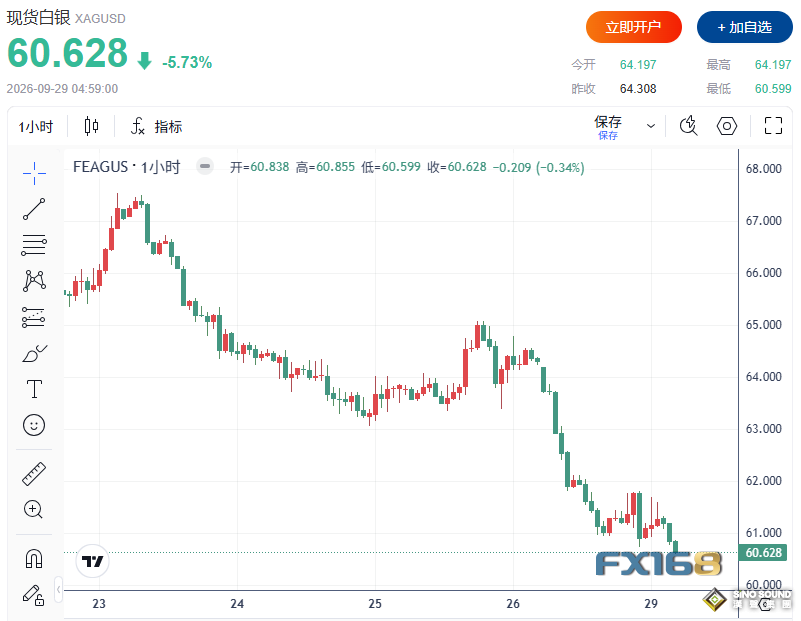
Spot silver closed at $61.020 per ounce, down 5.73%.
(Source: FX168)
Higher Oil Prices Fuel Inflation and Rate Expectations
Middle East geopolitics remain the core variable for oil and precious metal markets. Earlier in the session, oil jumped more than $4 per barrel after U.S. President Trump rejected Iran’s proposal to potentially reopen the Strait of Hormuz, before paring some gains after Qatari mediators signaled separate US-Iran talks would be held. Brent crude closed up 96 cents, or 0.9%, at $105.28 per barrel; WTI crude finished 19 cents higher, or 0.2%, at $92.60 per barrel.

Although crude pared its gains by the close, the wider Brent-WTI spread and peRSIstent shipping risk premium stoked inflation fears and pushed U.S. Treasury yields higher. For gold, safe-haven buying from geopolitical risk remains present, but price action on Monday was dominated by negative forces: rising oil prices lifted the market’s expected Fed policy path and increased the opportunity cost of holding non-yielding precious metals.
U.S. Treasury Yields and Dollar Exert Synchronized Pressure
Markets are still dominated by the narrative of “higher oil prices, higher yields, and a more hawkish Fed path”. Traders have priced in roughly a 70% chance of a 25-bASIs-point rate hike in October. The U.S. Dollar Index held near 101.16, close to a two-month high. Benchmark 10-year U.S. Treasury yields climbed to the 5.23% zone, the highest level since 2007.
In external markets, Nymex WTI crude trades around $92.60 per barrel while Brent crude stands near $105.28 per barrel. The 10-year Treasury yield hovers around 5.2%, and the U.S. Dollar Index remains firm. The Kitco Global Index quantifies how much of the current gold price volatility stems from dollar factors versus inherent gold market forces.
Going forward, markets will focus on Tuesday’s JOLTS job openings data, Wednesday’s August personal income and PCE inflation figures plus ADP private-sector employment data, Thursday’s ISM Manufacturing Index, and Friday’s September Non-Farm Payrolls report. Stronger-than-expected inflation or labor data may keep the rate channel weighing on gold. Weaker data, by contrast, will test whether the current selloff has fully priced in rate-hike risks.
U.S. and European Equities Pull Back in Tandem
In U.S. markets, the yield shock offset support from some AI heavyweight stocks, and major indices closed lower. The S&P 500 fell 59.72 points, or 0.8%, to 7683.69. The Dow Jones Industrial Average dropped 347.11 points, or 0.7%, to 51481.51. The Nasdaq Composite lost 248.34 points, or 0.9%, to 26820.38. The Russell 2000 declined 19.64 points, or 0.7%, to 2817.91.
European equities traded flat to slightly lower. Strength in the oil & gas sector offset weakness in bASIc resources and telecoms. The Euro Stoxx 600 closed unchanged at 638.68. Germany’s DAX fell 0.13% to 25374.42. France’s CAC 40 dipped 0.04% to 8078. The UK FTSE 100 lost 0.10% to 10684.88. Italy’s FTSE MIB dropped 0.21% to 51759.90.
Technical Levels for Gold and Silver Shift Lower
On the technical front, the next bullish objective for spot gold is to reclaim the $4199.00–$4223.90 resistance zone. A sustained breakout would open targets at $4244.00 and $4257.00. On the bearish side, a break below $4162.69 would push the next downside targets to $4152.00 and $4128.00. The primary resistance stands at $4199.00, followed by $4223.90; the first support is $4162.69, then $4152.00.
For spot silver, bulls need to push prices back above the $62.350–$63.150 zone. A breakout would target $64.080 and $64.820. The next bearish objective is a break below $60.890, with further downside to $60.830 and the psychological level of $60.000. Primary resistance is at $62.350, followed by $63.150; the next support is $60.890, then $60.830.