

Spot gold continued to weaken during Thursday’s ASIan morning session, with XAU/USD dipping near $4270. Following the sharp pullback from highs, market focus has shifted back to the Federal Reserve’s monetary policy path. Since gold bears no interest income, higher market expectations for future interest rates raise the opportunity cost of holding gold relative to US dollar assets and other yield-bearing assets, thereby weighing on gold prices.
Fed officials’ policy remarks this week have clearly leaned toward cautious tightening. Fed Governor Michael Barr stated that further policy adjustments may still be needed to bring inflation under control. Richmond Fed President Tom Barkin and Boston Fed President Susan Collins also backed the recent rate hike decision and noted inflationary pressures remain. Such comments have reinforced market expectations that the Fed will maintain restrictive policies for the rest of the year.
Shifts in the interest rate market have been quite evident. CME FedWatch data shows the market is currently pricing a roughly 69.7% probability of a 25-bASIs-point Fed rate hike in October, compared with around 48.7% one week ago. If US inflation and employment data continue to demonstrate resilience, pricing for additional rate hikes may keep rising, lending support to the US dollar and US Treasury yields and placing greater valuation pressure on gold.
Some precious metals market participants believe post-meeting Fed officials’ remarks are broadly hawkish, and the market is repricing the possibility of at least one more rate hike this year, which has become a major factor weighing on gold recently. Nevertheless, gold’s current correction is not driven solely by rate factors; changes in physical demand also deserve attention. Although global investors have reduced some gold allocations amid US rate expectations, physical purchases in ASIan markets and ETF inflows may still offer a certain buffer. If the US dollar continues to strengthen and US real rates rise further, gold remains under adjustment pressure in the short term. However, if price declines reignite physical buying in ASIa, demand absorption below may strengthen.
In terms of capital sentiment, the gold market now shows clear divergence. On one hand, hawkish Fed signals have reinforced expectations of “higher rates for longer” in the rate market, and a stronger US dollar directly suppresses gold. On the other hand, after the sharp prior correction in gold prices, some long-term funds and physical buyers may start to look for allocation opportunities brought by price dips. Therefore, the current market is more of a rebalancing between macro rate factors and physical demand forces, rather than a one-way trending move.
Key areas to monitor next include Fed officials’ speeches, US inflation and employment data, the US Dollar Index and changes in real US Treasury yields. Meanwhile, ASIan gold imports, ETF holdings and Shanghai market premiums are important indicators for judging the strength of underlying demand for gold. If US rate expectations keep rising, gold may test further technical support. If the US dollar and yields stage a periodic pullback, rebound room for oversold gold may reopen.
From the daily chart structure, spot gold is currently trading below the 100-day simple moving average and the 20-day BOLLinger Band midline, with a weak short-term technical setup. The price stands near $4270. The market will first watch technical pressure around the 100-day SMA, followed by the BOLLinger Band midline near $4375, a key zone to judge whether gold can regain strength. If prices can re-establish above $4375, attention will turn to the BOLLinger Band upper rail near $4530. On the downside, focus falls on the BOLLinger Band lower rail near $4222, forming important medium-term support. The 14-period RSI stands at roughly 45, not yet entering oversold territory, indicating weak momentum but consolidation, with no extreme bearish signals formed for now.
On the 4-hour timeframe, gold remains in a weak consolidation structure after the pullback. During rebounds, traders need to watch resistance in the $4300–$4375 zone. If prices fail to break above $4375 again, short-term rebounds may still be regarded as corrective moves, followed by potential retests of support at $4250 and even $4222. Conversely, if gold can break above $4375 on rising volume and hold that level, the short-term downtrend structure may improve, with further recovery toward the $4450–$4530 zone. Since the daily RSI has not shown obvious oversold conditions, risks of a secondary pullback triggered by shifts in rate expectations still need to be guarded against.
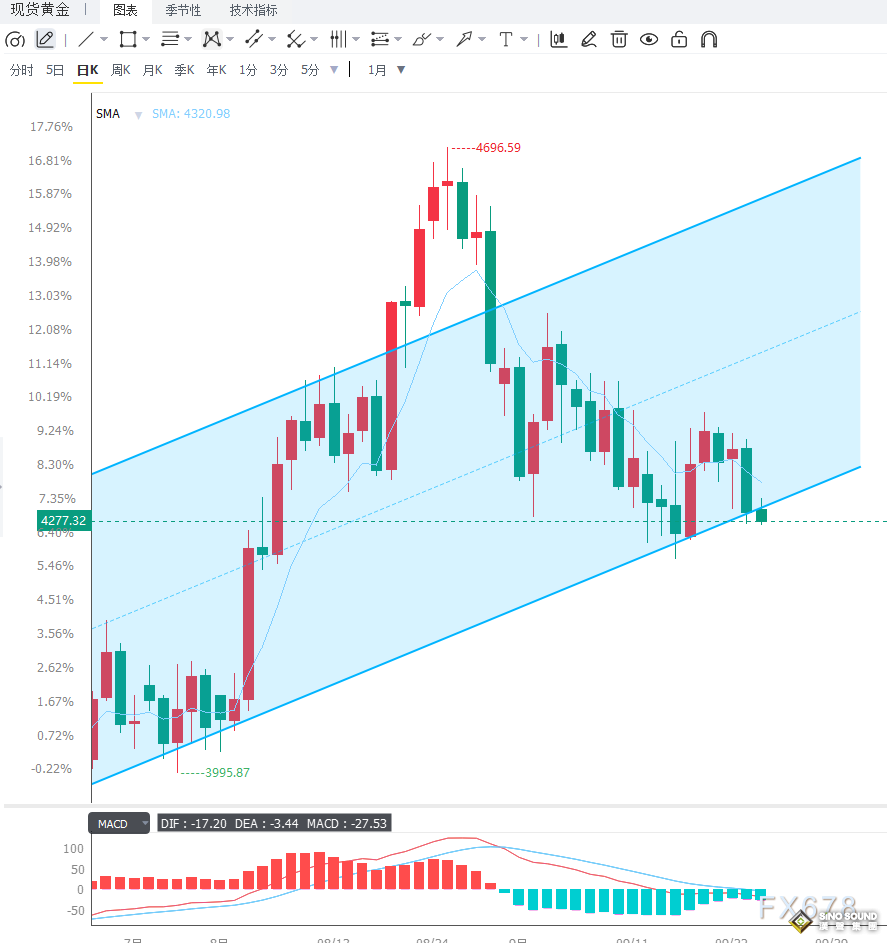
Gold is now at a critical stage of a tug-of-war between Fed policy expectations and physical demand. Hawkish policy signals and rising October rate hike expectations are the main factors weighing on gold’s short-term performance. At the same time, sustained growth in gold imports and ETF demand from major ASIan nations provides solid fundamental absorption for prices. In the short run, price action around $4290 remains weak. $4222 acts as major downside support, while $4375 is the key resistance to confirm whether rebounds can extend further. Going forward, the US dollar, real interest rates and Fed policy expectations will dictate gold’s direction, and physical demand from major ASIan nations may serve as an important buffer during gold’s price correction.