

After US September PMI data came in stronger than expected, market bets on another Fed rate hike in October rose rapidly, pushing US Treasury yields and the US dollar higher simultaneously. Spot gold and silver slumped sharply after the US close on Wednesday. At the same time, the stock, bond and commodity markets came under pressure in tandem, and sentiment for risk assets weakened overall.
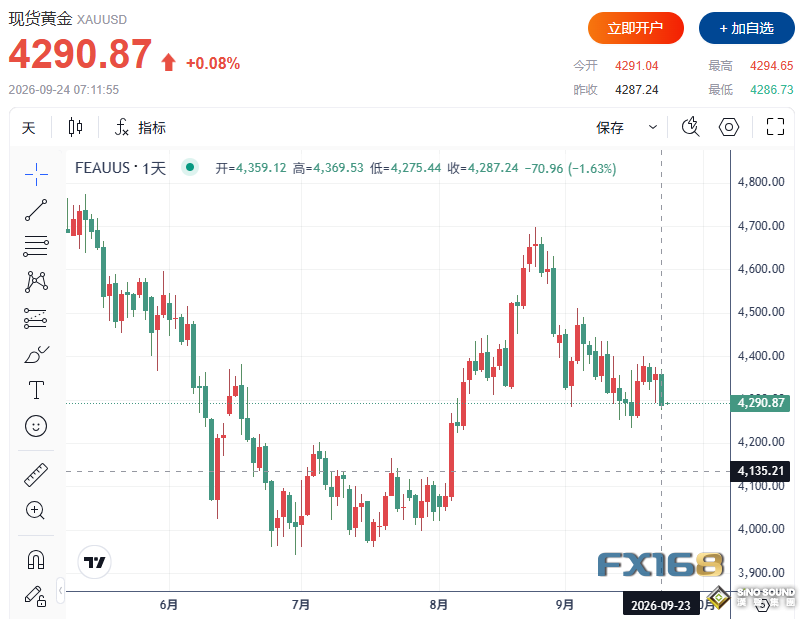
At the close of US trading, spot gold settled at $4287.24 per ounce, down $70.96 or 1.63% on the day; spot silver traded at $64.433 per ounce, a drop of 3.90%. The non-interest-bearing asset attribute of precious metals continued to be impacted under the dual pressure of higher yields and a stronger US dollar.
(Source: FX168)
PMI Surprises to the Upside
The US September flash composite PMI rose to 58.4, up from 56.0 in August and hitting the highest level since July 2021. Among them, manufacturing PMI climbed from 53.9 to 57.0, services PMI rose from 56.5 to 58.7; the input cost index increased from 59.9 to 66.4, the highest since October 2022.
After the data release, the federal funds futures market lifted the probability of an October rate hike to roughly 66% to 70.9%, higher than around 53% earlier in the day. The 10-year US Treasury yield once jumped to 5.106%, the highest since 2007; the 2-year US Treasury yield also advanced toward 4.90%. The US dollar strengthened broadly against the euro, pound sterling, Japanese yen and Canadian dollar, further weighing on non-yielding gold.
Stock Markets Come Under Pressure in Tandem
Tighter financial conditions brought about by bond sell-offs also dragged down the closing performance of US stocks. The S&P 500 index fell 58.61 points, or 0.8%, to 7706.03; the Dow Jones Industrial Average dropped 352.10 points, or 0.7%, to 51511.59; the Nasdaq Composite Index declined 308.24 points, or 1.1%, to 26936.04; the Russell 2000 index lost 51.26 points, or 1.8%, to 2838.66.
European stock markets also closed lower amid rebounding oil prices and rising government bond yields. The STOXX Europe 600 fell 0.37% to 640.39; Germany's DAX dropped 0.66% to 25410.63; France's CAC 40 slipped 0.39% to 8123.41; the UK FTSE 100 edged down 0.03% to 10705.26; the EURO STOXX 50 declined 0.31% to 6305.08; Italy's FTSE MIB fell 0.21% to 51987.49.
Rebounding Oil Prices Fuel Inflation Fears
Middle East tensions also created a macro trading environment with inflation and risk aveRSIon coexisting. Iranian officials stated that Tehran and Washington remain far apart on terms to end the conflict, while the US side continues to emphASIze diplomacy remains possible but no breakthrough has been achieved. As a result, Brent crude climbed back above $103 per barrel, and WTI crude traded near $92.60 per barrel. The market reassessed Middle East supply risks, tight diesel supply and fading diplomatic optimism seen on Tuesday.
The rebound in oil prices further lifted inflation expectations and resonated with rising yields, placing gold in a tug-of-war between geopolitical support and high-rate headwinds. Current external markets show Nymex WTI crude at roughly $92.60 per barrel, Brent crude around $103.50 per barrel, the benchmark 10-year US Treasury yield hovering near 5.1%, and the US dollar index remaining firm.
Gold and Silver Technical Levels in Focus
From a technical perspective, the next target for spot gold bulls is to reclaim the resistance zone of $4369.00 to $4400.00. A sustained breakout would open further upside toward $4511.00 and $4530.00. On the bearish side, a break below $4270.00 would expose further downside toward $4235.00 and the $4160.00–$4180.00 region. Short-term resistance sits at $4311.69 and $4343.85, while support levels are at $4275.00 and $4270.00.
For spot silver, bulls need to push prices back above the $66.505–$68.442 zone. A further breakout would target $68.000 and the $70.000 area. The next bearish objective is a break below $64.500, with further downside toward $63.430 near the 50-day moving average and the $61.000–$62.000 range. Short-term resistance is at $65.463 and $66.505, with the next support near $64.500.
Markets will turn their attention to weekly US initial jobless claims due out on Thursday evening Beijing time, as well as durable goods orders and final consumer confidence data on Friday. These figures may continue to drive short-term volatility in rate-sensitive precious metals.