

Gold Tumbles Intraday Then Bounces Back! US ISM Cools Unexpectedly, Yet “Hike Shadow” Still Looms, Gold‑Silver Next Focus on Non‑Farm Payrolls
FX168 Financial News (North America) – During US trading hours on Tuesday (Sep 1), both spot gold and silver tumbled sharply. Global bond‑market sell‑offs, a stronger US dollar and elevated oil prices jointly pressured precious metals. The market repricing of the Federal Reserve’s policy path following the Jackson Hole symposium remains the dominant driver for gold and silver at present.
Nevertheless, gold rebounded notably from its intraday low after the latest US manufacturing data came in below expectations. Gold had dipped as low as $4325.93 per troy ounce before bouncing swiftly upon the release of the ISM Manufacturing PMI. It was most recently trading around $4373 per troy ounce, still down 1.7% on the day.
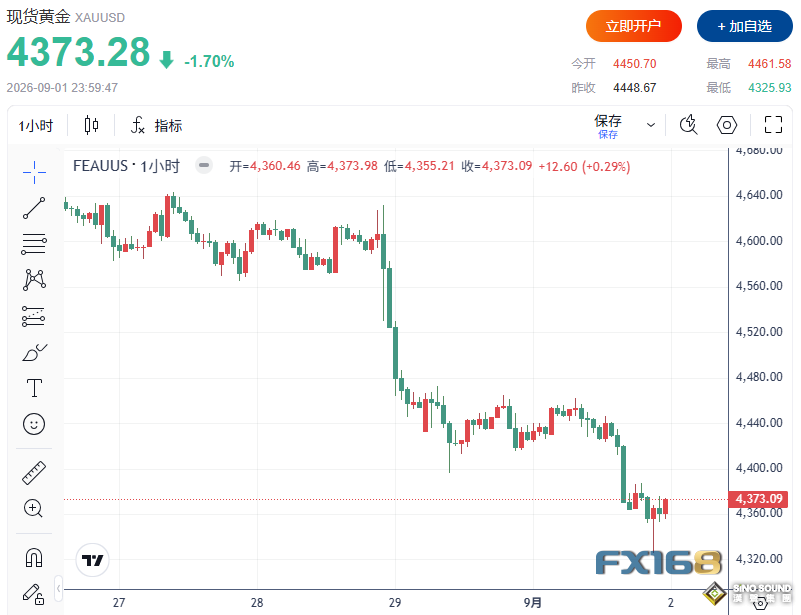
(Source: FX168)
Spot silver remained under pressure near $64 per troy ounce, with an intraday loss close to 2%.
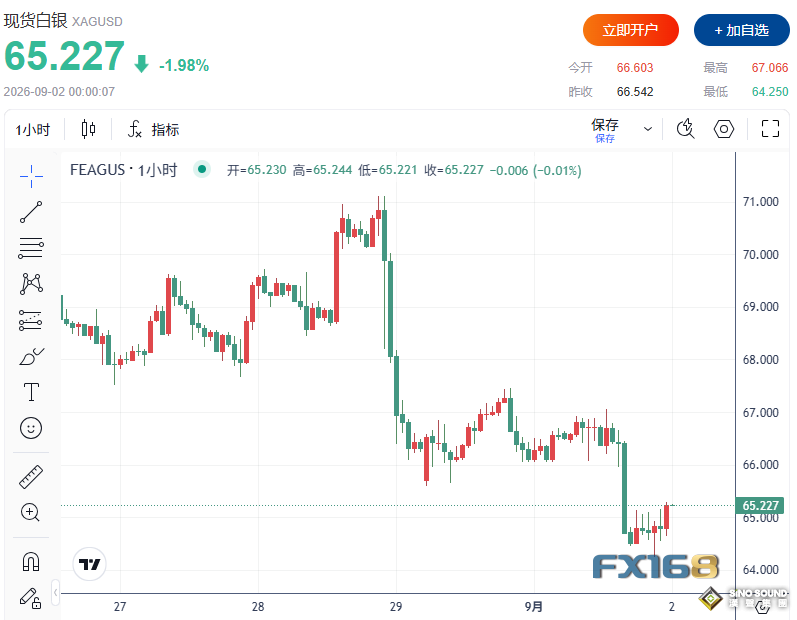
(Source: FX168)
This means the precious‑metals market is caught in an increASIngly visible tug‑of‑war over policy expectations. On one hand, surging US Treasury yields, a stronger dollar and rising oil prices reinforce bets for further Fed tightening. On the other hand, signs of cooling in some US economic data prompt investors to reassess the magnitude of rate hikes and the economic outlook.

ISM Misses Expectations, Gold Bounces From $4326 Low
Data released by the Institute for Supply Management (ISM) on Tuesday showed the August Manufacturing PMI fell to 54.6, below both the market consensus of 55.3 and July’s reading of 55.6.
Though the index remained well above the 50 expansion‑contraction threshold, signalling ongoing US manufacturing expansion, internal components showed fading growth momentum. Key gauges including new orders, backlog of orders and imports posted clear declines.
Susan Spence, Chair of the ISM Manufacturing Business Survey Committee, stated that US manufacturing activity stayed in expansion territory in August while multiple key metrics cooled. Among the five major PMI sub‑components, only supplier deliveries accelerated month‑on‑month, reflecting continued supply‑chain delays.
In detail, the New Orders Index dropped 3 points to 53.7 from July’s 56.7, though it remained in expansion for the eighth consecutive month. The Production Index edged down to 58.3 from 58.5. The Employment Index fell to 51.2 from 52.8, indicating slower manufacturing hiring expansion.
Buy‑side support swiftly emerged for gold following the release. Prior to that, gold had tumbled to $4326.27 amid higher Treasury yields and dollar strength. After the softer‑than‑expected ISM print, worries about an overheating US economy eased and gold bounced back above $4360.
Even so, the report has not fully eliminated risks of further Federal Reserve policy tightening.
One notable signal: the ISM Prices Index held steady at an elevated 71.1, unchanged from July. That means even as manufacturing demand and hiring momentum soften, corporate input costs remain extremely high.
This combination of “slower growth yet peRSIstent price pressures” is not unambiguously bullish for gold. Cooling data may dampen future rate expectations, but sticky price pressures will keep the Fed vigilant on inflation. That largely explains why gold staged a quick rebound yet could not reverse its intraday loss.
Market Sharply Prices in Higher Odds of September Rate Hike
The biggest pressure facing precious metals still stems from post‑Jackson‑Hole repricing across financial markets for Fed policy prospects.
Traders now peg the probability of a September Fed rate hike at roughly 66%‑67.5%. Previously, Federal Reserve Chair Kevin Warsh explicitly stated further monetary tightening cannot be ruled out if inflation fails to return to the 2% target.
His remarks directly triggered bond‑market reassessment of the interest‑rate path.
The US 10‑year Treasury yield climbed to around 4.79% on Tuesday, hitting its highest mark since January 2025. The policy‑sensitive 2‑year US Treasury yield also neared 4.35%.
That creates direct pressure on gold. Gold bears no interest payout, so climbing Treasury yields — especially real yields — raise the opportunity cost of holding bullion. A concurrent stronger dollar adds a second layer of pressure for dollar‑denominated gold.
Hence, despite worsening Middle‑East tensions that would normally boost safe‑haven demand, yield‑ and dollar‑driven headwinds have clearly outweighed traditional haven buying for now judging by price action.
Oil Nears $92, Middle‑East Conflict Fuels “Rate‑Hike Trade” Instead
Meanwhile, Middle‑East developments influence gold via another channel: oil prices and inflation expectations.
The Strait of Hormuz remains one of the global market’s top risk hotspots. On Sunday, the US struck Iranian rocket launchers on an island near the strait; US officials said those launchers were poised to deploy mines into the waterway. The United Arab Emirates later reported intercepting an Iranian drone over its territorial waters on Monday.
With hostilities disrupting this vital chokepoint handling roughly 20% of global oil shipments, international crude prices stayed elevated. Brent crude hovered near $92 per barrel, while US WTI crude traded around $87.67.
This creates one of the most contradictory trading environments for gold markets today.
Normally, escalating geopolitical strife benefits gold as investors rotate into safe‑haven assets. But if conflict drives crude sharply higher, US inflation expectations may rise, bolstering arguments for additional Fed rate hikes.
In other words, the same geopolitical crisis generates safe‑haven buying on one side while weighing on gold through the oil‑inflation‑interest‑rate chain. For the moment, the latter dynamic prevails.
Global Bond Sell‑Offs, Risk Assets Come Under Concurrent Pressure
Precious‑metals declines are not an isolated phenomenon.
Risk assets faced broad pressure on Tuesday amid rising global bond yields. Ahead of US market open, S&P 500 futures fell 0.6%, Dow futures dropped 0.8% and Nasdaq futures slid roughly 1.0%, with rate‑sensitive tech shares relatively weak.
European equities also traded lower: Germany’s DAX fell around 1.0%, France’s CAC 40 lost 0.4%, UK FTSE 100 dipped about 1.0%, and major ASIan bourses faced broad headwinds.
Markets are adjusting to an environment of “higher rates for longer, and potential further hikes”. Gold, silver, bonds and richly‑valued tech stocks have all become sensitive assets amid this round of policy‑expectation reset.
Non‑Farm Payrolls May Determine Gold’s Next Directional Break
The ISM print is only the first hurdle in this week’s heavy US economic‑data calendar.
Markets will next watch JOLTS job openings, ADP employment report, initial jobless claims, ISM Services PMI, and Friday’s highly‑anticipated August Non‑Farm Payrolls report.
For gold, the labour market will likely serve as the key variable defining its next phase trend.
If employment data remains robust — especially strong payroll additions and wage growth beating forecasts — market pricing for a September hike will gain further traction, potentially lifting Treasury yields and the dollar and pressuring gold to retest key support levels.
Conversely, material downside surprises in employment figures could trigger rapid scaling‑back of September‑hike bets. With gold already having corrected substantially, that could act as a direct catalyst for a more forceful technical bounce.
Accordingly, the core question for gold this week has shifted away from “will Middle‑East tensions worsen?” toward “is the US economy strong enough to justify additional Federal Reserve rate hikes?”
Key Technical Levels for Gold & Silver
Technically, gold’s near‑term trend stays bearish.
Gold has hit its lowest level since August 19. It has broken below the 200‑day moving average, and Monday’s rebound failed to recapture the important resistance zone of $4452‑$4487, signalling peRSIstent overhead selling pressure.
Gold first needs to reclaim $4396. A valid break above that opens resistance targets at $4452 and then $4487.
On the downside, watch the $4353 and $4347.36 zones closely. A decisive break under $4347 may send gold toward $4308.10 and even test support near $4247.03.
Silver’s technical picture is equally weak. It has breached $65.64 support and trades beneath the $66.87 near‑term pivot. Should yields and the dollar keep strengthening, immediate downside focus falls on $62.98; a loss there exposes further supports at $61.51 and $60.835.
To the upside, silver must first retake $65.64 before challenging $66.87 and $67.75.
Overall, the softer‑than‑expected ISM manufacturing print delivered a notable low‑level bounce for gold, yet it does not alter the core market trading narrative. With Treasury yields near recent highs, the dollar firm, and oil prices keeping inflation risks elevated, gold and silver remain in a policy‑driven trading phase characterised by high volatility and heightened sensitivity.
The week’s remaining employment releases, especially Friday’s August Non‑Farm Payrolls report, will likely decide whether this gold pull‑back represents a deep correction within an uptrend or the start of a larger‑scale repricing.
In this veRSIon, I deliberately avoided framing “ISM is bullish for gold” in absolute terms. Instead, I highlighted the core contradiction — “cooling economic momentum but still‑elevated price pressures”. This naturally explains why gold bounced sharply from $4326 yet still finished the day down nearly 2%.