

Renowned financial website Finbold reported on Monday (August 31) that if historical market cycles repeat, gold prices could drop to the $3,000‑$3,200 per‑ounce range by 2030. The forecast comes from a long‑term analysis covering more than 50 years of gold price performance.

(Screenshot Source: Finbold)
At press time, gold was trading around $4,444 following a strong August rebound.
Despite gold’s recent recovery, an analysis published by TradingShot on TradingView on August 31 argues that gold remains in the early phase of a new bear‑market cycle. This cycle began in January 2026, after gold surged above $5,500 to hit an all‑time high.
Studying gold market cycles dating back to 1970, the analysis identified a recurring pattern:

Gold typically goes through a 10‑year to 10.5‑year bull‑market rally, followed by a 4.2‑year to 5‑year bear‑market decline.
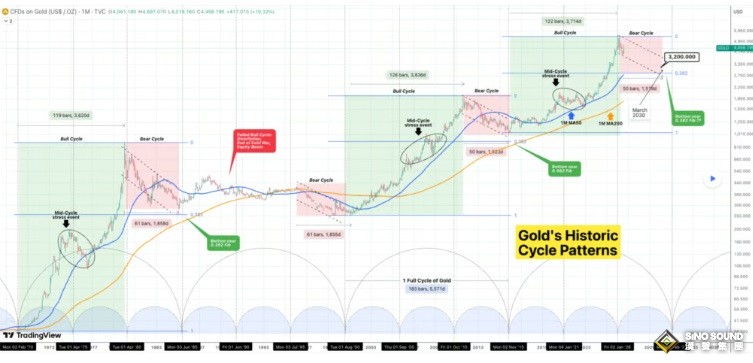
(Gold Price Analysis Chart Source: TradingView)
Per this forecast, the pullback from the January 29, 2026 high is not a short‑lived correction within the long‑term uptrend. Instead, it may mark the start of a fresh bear‑market cycle.
Based on historical cycle patterns, the gold market could bottom as early as March 2030. If the bear cycle extends further, the low may be delayed until December 2030.
The analysis notes that past gold downturns followed comparable trajectories, though the 1985‑1995 period was excluded. That era featured low inflation and the end of the Cold War, which invalidated gold’s prior bull run.
Gold’s Correction Scope: Warnings From Historical Data
Beyond cycle‑timing analysis, the report studied historical correction magnitudes using FibonaCCI retracement metrics.
Data shows two major prior bear‑market lows, in 1985 and 2015, formed near the 0.382 FibonaCCI retracement level, with long‑term moving averages offering additional support.
Should the current gold cycle follow a similar pattern, gold could fall toward the following zone by 2030:
$3,000‑$3,200 per ounce.
That implies a roughly 28%‑33% drop from current prices near $4,450.
This target zone also sits close to the long‑term 200‑month moving average highlighted in the analysis.
Gold Retains Solid Support, Bull‑Bear Tug‑of‑War PeRSIsts
While historical cycle models point to price headwinds for gold in coming years, multiple structural factors continue to underpin the metal.
Global central‑bank gold purchases remain elevated. Meanwhile, market worries over rising government debt, currency debasement and geopolitical risks keep fuelling investor demand for gold.
Furthermore, gold has recaptured investor attention following its sharp August rally.
High interest rates nonetheless constitute one major risk for gold.
As markets focus increASIngly on Federal Reserve policy signals, rising bond yields lift the opportunity cost of holding non‑yielding assets such as gold, thereby exerting downward pressure on its price.