

Gold and silver slumped sharply into Friday’s US close after Federal Reserve Chair Kevin Warsh reinforced anti‑inflation rhetoric at the Jackson Hole Symposium. Warsh’s hawkish remarks quickly lifted market expectations for a September Fed rate hike. Short‑dated US Treasury yields and the US dollar advanced in tandem, triggering heavy selling across precious‑metals markets.
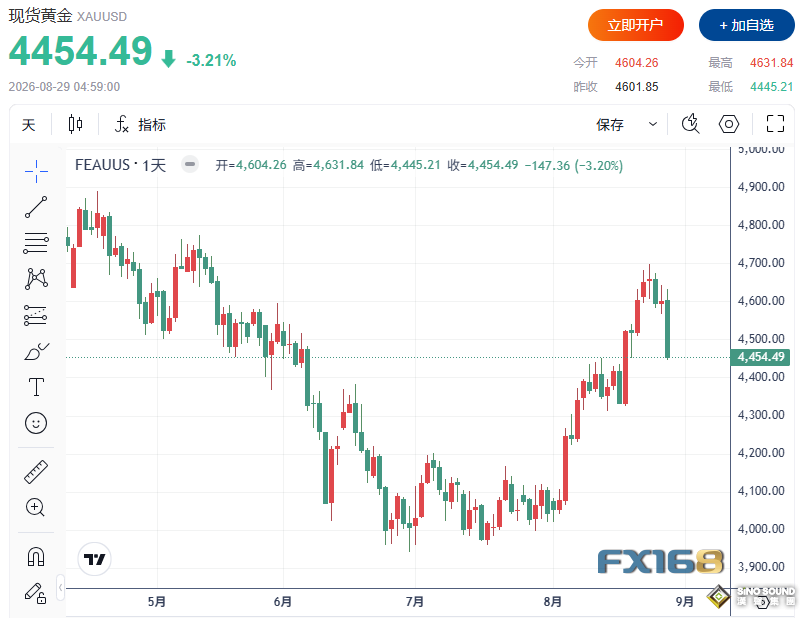
Spot gold settled at $4454.49 per ounce, down $147.36 or 3.20% on the day. #GoldMarketWrapUp#
(Source: FX168)
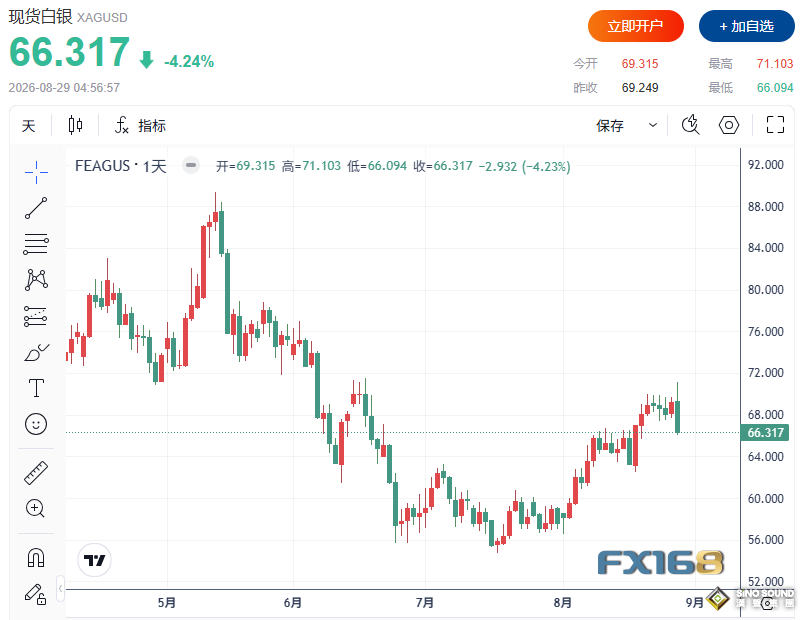
Spot silver closed at $66.317 per ounce, with a loss of 4.24%. As global markets repriced the Fed’s interest‑rate path, precious metals ranked among the hardest‑hit assets of the session.
(Source: FX168)
Warsh Turns Hawkish, September Rate‑Hike Bets Soar
In his Jackson Hole address, Warsh stressed that the Fed must secure price stability. If underlying inflation fails to move convincingly and quickly toward the 2% target, the central bank “has more work to do”.

These remarks swiftly reshaped market expectations for the September policy meeting. Traders pushed the probability of a September Fed rate hike up to 57.5%, well above the prior reading of roughly 35.9%.
Rate markets adjusted sharply in response. The two‑year US Treasury yield rose 11.8 bASIs points to 4.348%, and the US Dollar Index gained around 0.5%. For gold and silver, a stronger dollar plus higher real and nominal interest rates raise the opportunity cost of holding non‑yielding precious metals, directly weighing on prices.
Meanwhile, preliminary non‑farm payroll benchmark revisions released by the US Labor Department failed to deliver the bullish outcome gold bulls had hoped for. Revisions showed payrolls were overstated by roughly 79,000 as of March 2026, a downward adjustment far smaller than the steep cuts some traders had feared.
Markets had previously priced in a sharper deterioration in employment data that would bolster arguments for Fed eASIng. The final figures, however, were not enough to offset the hawkish shock from Warsh’s speech.
Gold Breaks Below 200‑Day MA, Technical Picture Deteriorates Noticeably
As rate expectations repriced rapidly, gold’s technical profile worsened alongside.
Spot gold broke below the 200‑day moving average near $4526 and then lost the key technical zone around $4480, dipping toward $4450 intraday.
Near‑term, $4458 stands as a critical battleground for bulls and bears. Should this support give way, gold may extend losses toward $4320, followed by the $4230 zone.
Conversely, for a rebound to take hold, price needs to reclaim $4504 first, then the 200‑day MA at $4526. Only a decisive recapture of this major moving average would ease near‑term technical pressure, with the next upside target near $4600.
From a technical‑structure perspective, gold has shifted from prior range‑bound highs to a clearly defensive posture. Whether price can reclaim the 200‑day MA quickly over coming sessions will serve as a key signal distinguishing between a short‑term liquidation and the start of a larger correction.
Silver Cracks Multiple Key Support Levels
Silver also suffered severe losses. After failing to break above the $70 threshold, silver sequentially broke down through $69.96, $69.50 and $67.69, and at one point neared $66.
If silver can retake $67.69, near‑term rebound targets return to $69.50 and then $70. Should $66 fail to hold, further downside tests may emerge at $65.66 and $64.20.
While silver’s medium‑term breakout structure has not been fully invalidated, Friday’s sharp pullback has significantly eroded near‑term bullish momentum.
Lower Oil Prices Further Remove Tailwinds for Precious Metals
Beyond Fed‑driven factors, retreating crude‑oil prices weakened both inflation‑hedge and safe‑haven narratives for gold and silver.
Markets continue monitoring tensions in the Strait of Hormuz and months‑long conflicts between US‑Israel and Iran. Friday’s crude‑oil moves were dominated, however, by eASIng supply concerns. Traders digested reports of potential shipping arrangements for the Strait of Hormuz and signs that larger crude volumes can keep transiting the waterway.
Seven commodity tankers passed through the Strait of Hormuz on Thursday, down from 17 the prior day and below the 10‑day average of roughly 15 vessels.
Front‑month Brent crude fell to around $89.31 per barrel, while Nymex crude traded near $83.18.
Cooler oil prices reduced portions of the inflation premium and diminished the urgency for capital to flow into gold. Iranian risks, sanction threats and broad global geopolitical uncertainty still offer some safe‑haven underpinnings, yet those forces were insufficient to offset hawkish Fed‑driven headwinds.
Dollar and US Treasuries Represent the Main Weight on Gold and Silver
Across cross‑asset markets, Friday’s core pressure on precious metals stemmed from the US dollar and US Treasury yields.
The US Dollar Index strengthened peRSIstently, short‑dated Treasury yields climbed sharply, and the 10‑year US Treasury yield held near 4.7%. As markets re‑price prospects for additional Fed tightening, global capital is reassessing the relative appeal of gold and silver versus dollar‑denominated assets.
For gold, the dominant market question has shifted from “can it retest all‑time highs?” to “will the $4450 zone hold its ground?”
Sticky US inflation prints ahead paired with further hawkish rhetoric from Fed officials could expose precious metals to deeper near‑term corrections. By contrast, meaningful recovery for gold and silver will require distinctly softer employment and growth data that pull rate‑hike expectations lower once again.