

On Wednesday (August 26), during the European‑U.S. trading session, a spokesperson for the Islamic Revolutionary Guard Corps stated that Iran and Oman had reached an agreement on revenue sharing for the Strait of Hormuz. Although the deal has not been fully finalized, eASIng inflation concerns triggered a gold rebound. Shortly afterwards, hotter‑than‑expected PCE data reignited inflation worries and sent gold sharply lower. Spot gold is currently trading near 4622, down 0.79%, yet the overall trend remains strongly bullish.
In August 2026, the international gold market staged an extremely powerful rebound. Gold surged 15% for the month, marking its strongest monthly gain in more than four months.
This sharp turnaround completely reversed the previous downtrend, making gold the standout performer among recent commodity markets.
Even so, gold has not fully recovered all prior losses. Compared with its all‑time high above $5500 per ounce hit in January this year, prices are still roughly 16% lower. Gold’s early‑August low neared $4600 per ounce.
Looking back on the current rally, geopolitical tensions weighed on gold in the early phase.
Escalating Iran‑related conflict pushed crude‑oil prices higher. Markets feared prolonged high global inflation, which in turn fueled expectations for continued Federal Reserve rate hikes.
Fed rate‑hike cycles tighten liquidity, pulling gold and other financial assets lower. Meanwhile, sharp asset declines and disrupted oil exports forced Gulf nations and large energy importers such as Turkey to sell gold for U.S.‑dollar cash flow.
By August, however, the macro backdrop shifted entirely. Multiple positive drivers combined to launch gold’s powerful comeback.
U.S. Dollar Weakens + Treasury Yields Fall, No Unexpected PCE Heating‑Up

Double weakness in the U.S. dollar and Treasury yields forms the core macro driver behind gold’s powerful rally.
Markets now widely expect the Federal Reserve to hold interest rates steady, fully reveRSIng earlier hawkish rate‑hike fears.
Relative to interest‑bearing financial assets, gold’s disadvantage as a non‑yielding asset has diminished greatly. The opportunity cost of holding gold has fallen noticeably, boosting its appeal rapidly.
Today’s PCE release showed headline inflation rising 0.2% to 3.3%, yet core PCE excluding oil prices remained at 3.3% with no unexpected overheating. Rate‑market futures barely moved, and the probability of a September rate hike stays near 36%.
Meanwhile, the U.S. Treasury rolled out major policy, planning to double long‑term Treasury buybacks to at least $4 billion per operation.
This measure helps dampen long‑dated Treasury‑yield volatility, caps upward pressure on long‑end rates, and indirectly weighs on the U.S. dollar.
A weaker U.S. Dollar Index substantially lowers gold‑buying costs for global overseas purchasers, further stimulating global gold consumption and investment demand and pushing bullion prices higher.
On the geopolitical front, Iran and Oman appear close to finalizing a Strait of Hormuz governance deal that resolves revenue‑sharing questions. Positive prospects for restored strait shipping have kept oil prices at recent lows, which also benefits gold.
Global Gold ETF Inflows Return, Market Sentiment Improves
Returning investment flows into gold ETFs constitute a key direct driver of this rebound.
As risk sentiment and macro expectations reversed, institutional and retail investors increased gold allocations. According to the World Gold Council, global gold‑ETF holdings keep expanding, with recent additions of 23 tonnes;
Since August, inflows have accelerated further, reaching 45 tonnes month‑to‑date. Sustained net ETF inflows directly reflect sharply higher portfolio demand for gold and provide solid capital support for higher prices.
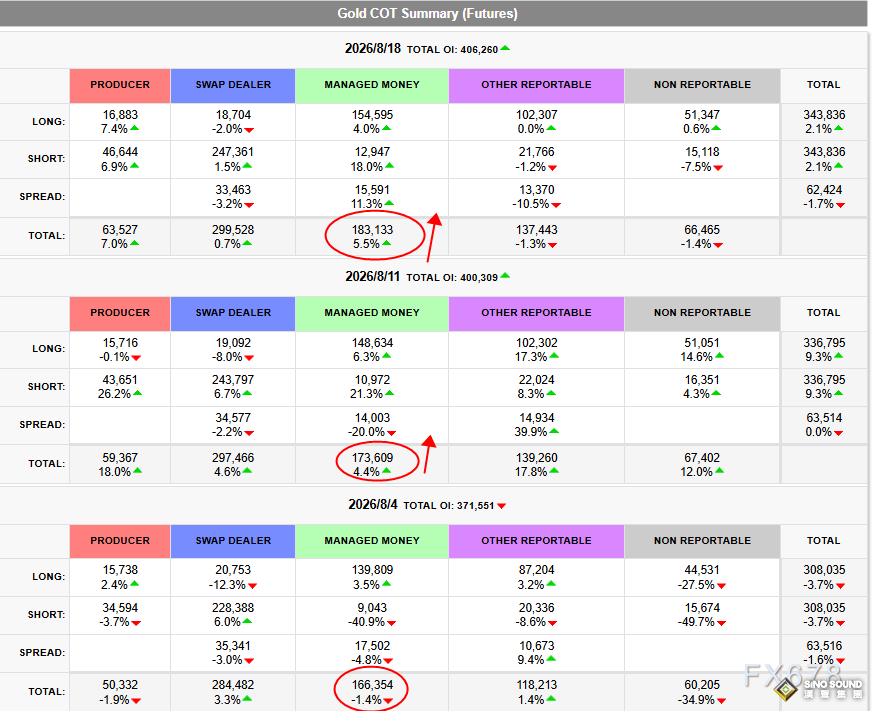
(CFTC COT positioning report, Source: CME Group)
Global Central‑Bank Gold Purchases Build Solid Price Floor
Regular gold buying by central banks reinforces gold’s long‑term value base and effectively hedges against market‑volatility risks.
Data shows global central‑bank gold purchases hit 288.9 tonnes in Q2 this year, surging 62% year‑on‑year. Official gold demand has exploded higher.
Among buyers, the Bank of Korea re‑entered the gold market for the first time in 13 years, further confirming the durability of the global central‑bank gold‑buying trend.
World Gold Council survey data highlights this secular trend: 89% of surveyed institutions expect global gold‑reserve growth over the next twelve months, while a record 45% of central‑banks explicitly plan to expand gold holdings further.
Large‑scale, steady long‑term official buying significantly reduces gold’s downside risk and underpins the current rally.
Summary Analysis:
Gold’s 15% monthly surge stems from three overlapping positives: fund inflows, official physical demand, and shifting monetary‑policy expectations, marking a phase trend reversal for gold.
Nevertheless, precious‑metals prices are highly volatile. After sharp short‑term gains, technical pull‑back risks remain.
For investors, chASIng highs blindly is not advisable when building gold exposure. Decisions should align with personal financial goals, risk tolerance and investment horizons. Position‑size control is critical to mitigate short‑term price swings.
Technically, spot gold has pulled back modestly. Immediate support lies near the 5‑day moving average and the upper edge of the consolidation box. Resistance sits close to the 0.786 FibonaCCI retracement level around 4749.
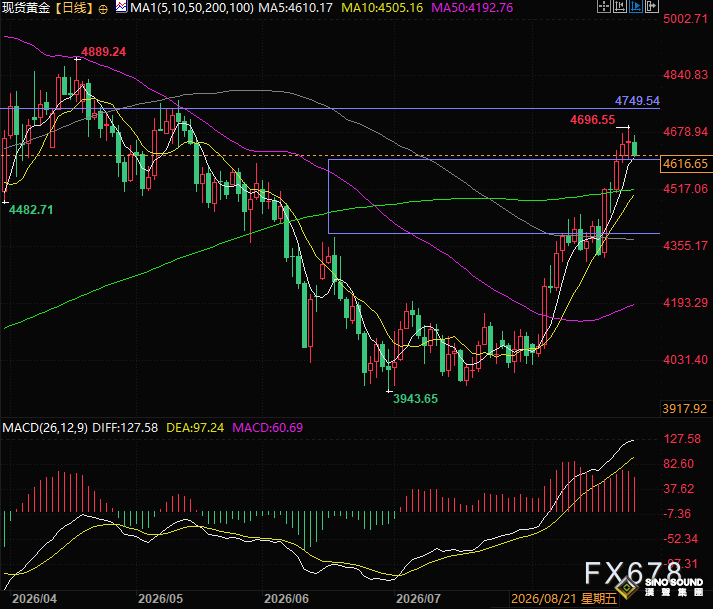
(Spot gold daily chart, Source: Yihuitong)
At 20:58 Beijing time, spot gold quotes $4614 per ounce.