

During Wednesday’s (August 26) ASIan session, spot gold edged lower and traded near $4,655 per ounce. For the trading day, investors will focus on the US PCE Price Index, which is expected to trigger significant market moves. FXStreet Chief Analyst Valeria Bednarik has published an article analysing gold’s technical outlook.
Bednarik writes that spot gold has undergone a pullback, yet technical indicators point to further upside potential ahead. Market participants are awaiting the US Personal Consumption Expenditures (PCE) Price Index for fresh trading cues.
Bart Melek, Global Head of Commodity Strategy at TD Securities, commented: “I believe this is merely a pause in momentum. If we have to name a cause, gold has hit strong resistance around the $4,700‑per‑ounce level.”
Markets are now focused on the US July PCE Price Index due Wednesday. The Federal Reserve monitors PCE data to gauge progress toward its 2% inflation target. Meanwhile, moderate Producer Price Index and Consumer Price Index readings released this month have dampened market expectations for near‑term Fed rate hikes.

According to CME FedWatch Tool, traders currently assign only a 38% probability to a September rate hike.
Bednarik notes that market attention turns to the US PCE Price Index, the Fed’s preferred inflation gauge. June’s headline PCE rose 3.7% year‑on‑year while core PCE stood at 3.3% year‑on‑year; markets expect the core reading to remain unchanged. Any uptick in inflation pressure could raise odds for Fed tightening and boost the US Dollar intraday.
Gold loses appeal amid high‑interest‑rate environments because bullion generates no interest income.
Gold Technical Analysis
Bednarik states gold retains its bullish bias despite the recent pullback. On the four‑hour chart, prices are consolidating above the 20‑period Simple Moving Average (SMA) at $4,616.76 per ounce. The 100‑period and 200‑period SMAs sit at $4,385.67 and $4,220.21 respectively, well below current levels and reinforcing the established uptrend. The Relative Strength Index (RSI) hovers near 64, and the 14‑period Momentum indicator stays positive, showing buyers remain in control even amid the current pause.
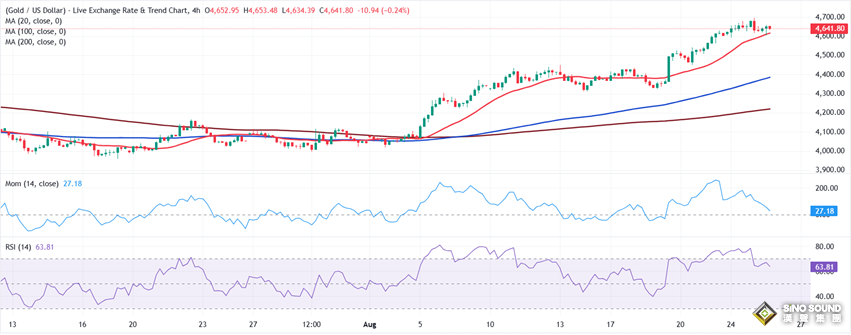
(Spot Gold 4‑Hour Chart, Source: FXStreet)
On the daily chart, gold holds above its 20‑day, 100‑day and 200‑day SMAs clustered roughly between $4,338 and $4,520 per ounce, underpinning the near‑term bullish setup. The RSI stays above 70; Momentum has retreated from elevated levels yet remains far above the mid‑line. This suggests further upside may lie ahead, while also leaving prices vulnerable to corrective pullbacks.
Bednarik adds that initial downside support rests at the 20‑period SMA near $4,616.76. On deeper pullbacks, further support emerges at the 100‑period SMA around $4,385.67 and the 200‑period SMA near $4,220.21. As long as gold trades above these moving averages, the broader bullish structure stays intact. A break above $4,700 would first target the $4,730 zone and open a path toward $4,800.
At 10:01 Beijing Time, spot gold traded at $4,655.27 per ounce.