

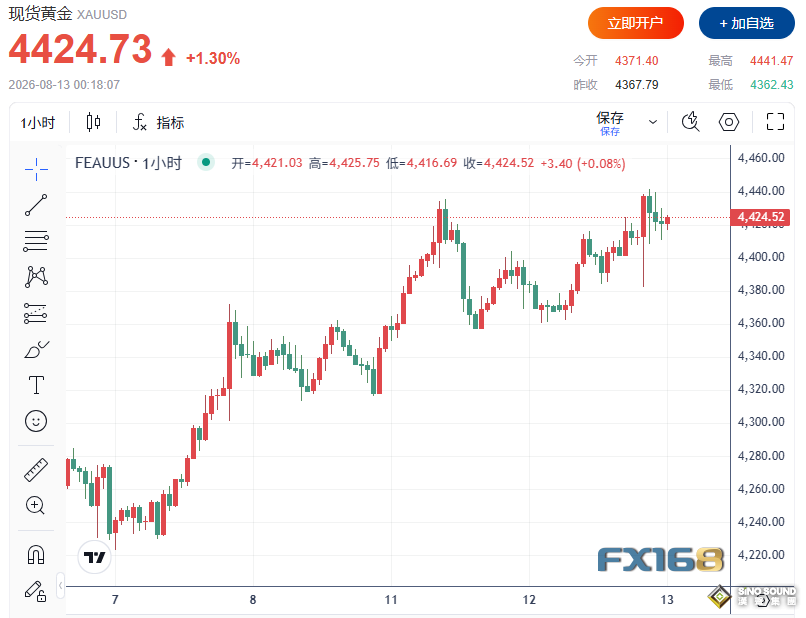
On Wednesday (August 12), spot gold extended its rally and broke above the $4400 threshold as investors digested the latest U.S. inflation data. Overall, July’s CPI largely matched market expectations, dragging down the U.S. Dollar and Treasury yields and delivering further upside support for bullion. As of press time, spot gold stood at $4424.73 per troy ounce, up 1.3%, having hit an intraday peak of $4441.47 earlier; spot silver traded at $65.819 per troy ounce, rising 1.7%.
(Source: FX168)
The U.S. July Consumer Price Index (CPI) rose 0.1% month-on-month, compared with a 0.4% drop in June. The year-on-year inflation rate slowed from 3.5% to 3.4%. Core CPI, which excludes volatile food and energy components, climbed 0.2% month-on-month after being flat in the prior month, with its annual growth eASIng from 2.6% to 2.5%.
Following the data release, the U.S. Dollar and Treasury yields came under broad pressure. The U.S. Dollar Index (DXY) hovered around 99.70, down 0.10% on the day. Treasury yields fell across the curve: the 2-year Treasury yield dropped roughly 4 bASIs points from the opening level to around 4.18%.
Although U.S. inflation remains above the Federal Reserve’s 2% long-run target and climbing oil prices pose renewed upside inflation risks, the July CPI print failed to materially reinforce market bets on additional rate hikes. Per the CME FedWatch Tool, the probability of a Fed rate hike in September fell further from around 44% pre-data to approximately 38%.
EASIng Hike Expectations Fuel Bullish Momentum for Gold
TD Securities noted that precious metals retained upward momentum after the latest U.S. CPI release, as the inflation report did not reignite market pricing for Federal Reserve tightening.
The broker pointed out that gold’s recent price action underscores a growing market consensus that the Fed will pause rate hikes. Since the last FOMC meeting, positioning from macro strategy funds, inflows into gold ETFs and central bank gold purchases have all strengthened markedly, reinforced by soft U.S. economic indicators of late.
Notably, gold is rallying alongside rebounding energy prices, signaling a shift in market narrative from pure rate-cut or pause bets toward growing concerns over stagflation risks.
TD Securities added that the "stagflation trade" could gather further traction so long as markets expect Fed Chair Kevin Warsh to refrain from aggressive monetary tightening in response to higher energy costs.
This dynamic is particularly supportive for gold. Ordinarily, surging energy prices stoke inflation expectations and lift interest rate pressures, weighing on non-yielding bullion. However, if investors believe the Fed will not overreact to energy-driven short-term inflation, elevated oil prices will amplify fears of slowing growth paired with peRSIstent inflation, boosting gold’s safe-haven value and portfolio allocation appeal.
Technical Outlook: Gold Approaches Key Resistance at $4500
On the technical front, spot gold has firmly held above the 50-period Simple Moving Average (SMA) and edged slightly above the 100-period SMA, keeping the short-term technical bias firmly bullish.
The primary technical resistance lies near $4500 per troy ounce, coinciding with the 200-period SMA, a critical hurdle for the next leg of upside.
Meanwhile, the Relative Strength Index (RSI) stands at roughly 68, nearing the conventional overbought zone. It indicates robust upward momentum yet hints at potential consolidation pressure at elevated levels in the near term.
The Average Directional Index (ADX) reads around 30, confirming a well-established directional trend in the market. The broader uptrend remains intact as long as gold prices stay anchored above the short and medium-term moving averages.
On the downside, the first major support aligns with the 100-period SMA at about $4388. In the event of a deeper pullback, the 50-period SMA near $4148 will act as secondary key support, likely attracting dip-buying interest.
Further down, structural support is anchored around the psychological $4000 round number.
To the upside, the 200-period SMA at $4500 remains the pivotal breakout target for gold bulls. A decisive break and sustained hold above this level would unlock extended medium-term upside potential. Conversely, a failure to clear the $4500 barrier will likely trigger prolonged sideways consolidation above the moving average support zone.
In summary, U.S. July inflation printed in line with forecasts and failed to reignite aggressive September Fed hike bets. Lower USD and Treasury yields, diminished tightening odds, and a heating stagflation narrative driven by rising energy prices have underpinned gold on both macroeconomic and technical fronts.
Short-term focus centers on the $4500 resistance zone as the core battleground between bulls and bears. A breakout will fuel bets on a fresh rally leg, while a rejection warrants caution over profit-taking triggered by the RSI’s proximity to overbought territory.