

Driven by peRSIstently elevated US Dollar and US Treasury yields together with the hawkish rate hike outlook of the Federal Reserve, spot gold trended downward under pressure overall last week. Gold closed at $4284.65 per ounce last Friday, up 0.26%, yet posted a weekly loss of 2.18%. Spot silver settled at $64.237 per ounce, gaining 0.67% for the day and falling 3.07% on a weekly bASIs.
During Monday’s ASIan session, spot gold opened at $4278.38 per ounce, hitting an intraday high of $4278.57 per ounce. Gold then came under pressure and retreated, once breaking the $4200 threshold to a low of $4194.08 per ounce. At press time, gold was trading near the $4201 level, down 1.96% for the day.
The US Dollar Index traded sideways within the lower range last Friday night, touching a low of 100.87 before closing at 101.03, down 0.21% on the day and up 0.82% for the week, marking two consecutive weeks of gains. The 2-year US Treasury yield fell 6.4 bASIs points to settle at 4.864%, rising 12.1 bASIs points week-on-week for six straight weeks of increases. The 10-year US Treasury yield dropped 3.8 bASIs points to close at 5.167%, up 17.1 bASIs points on the week for four consecutive weekly gains. The 30-year US Treasury yield climbed 2.3 bASIs points to 5.502%, with a weekly gain of 17.5 bASIs points.
The US and Iran entered negotiation phases. International crude oil prices fluctuated and fell last Friday. WTI crude oil closed at $92.34 per barrel, down 2.74% for the day and 3.22% week-on-week, falling for two consecutive weeks. Brent crude oil settled at $97.33 per barrel, a drop of 3.33% for the day and 1.38% on the week, also posting losses for two straight weeks.

All three major US stock indices rose last Friday night. At the close, the Dow Jones Industrial Average rose 478.61 points, or 0.93%, to 51828.59. The S&P 500 increased 39.38 points, or 0.51%, to 7743.51. The Nasdaq Composite climbed 129.34 points, or 0.48%, to 27068.72.
Most major European stock indices closed higher. The German DAX 30 rose 0.57% to 25399.89. The UK FTSE 100 gained 0.15% to 10696.17. France’s CAC 40 dipped 0.04% to 8077.80. The Euro Stoxx 50 rose 0.41% to 6298.15. Spain’s IBEX 35 advanced 0.64% to 19698.09. Italy’s FTSE MIB climbed 0.61% to 51857.50.
Holdings of SPDR Gold Trust, the world’s largest gold ETF, stood at 1054.555 tonnes last Friday, unchanged from the previous trading day. Holdings of iShares Silver Trust, the world’s largest silver ETF, increased by 16.86 tonnes from the prior session to 15378.69 tonnes.
Gold T+D on the Shanghai Gold Exchange fell 1.37% at Monday’s opening to 914.41 yuan per gram. Silver T+D dropped 1.7% to 15369.0 yuan per kilogram. As of 10:30 today, prices of gold bars from major banks and brands were mostly lower with few gains. Gold bar prices from Industrial and Commercial Bank of China, Laofengxiang, Chow Sang Sang and others declined, with Chow Sang Sang seeing the largest drop of 19 yuan per gram compared with the previous day.
In today’s foreign exchange market central parity rate of RMB, USD/CNY was quoted at 6.7399, down 90 pips (RMB appreciation). EUR/CNY stood at 7.6564, down 67 pips. HKD/CNY was 0.85923, down 13.1 pips. GBP/CNY was 8.9007, down 146 pips. AUD/CNY was 4.7182, down 205 pips. CAD/CNY was 4.7510, down 225 pips. 100JPY/CNY was 4.2685, up 95 pips. CNY/RUB was 12.5469, down 795 pips. NZD/CNY was 3.8051, down 168 pips. CNY/MYR was 0.60532, down 12.5 pips. CHF/CNY was 8.1123, down 539 pips. SGD/CNY was 5.2620, up 22 pips.
The latest data released last Friday night showed US August durable goods orders at 0% month-on-month, against an expectation of -0.4% and the prior reading revised up from 1.10% to 0.9%. The final reading of the UniveRSIty of Michigan US Consumer Sentiment Index for September was 48.1, versus a forecast of 47.6 and previous 47.8. The final one-year US inflation expectation for September was 4.6%, unchanged from the prior reading of 4.60%.
Survey data from the UniveRSIty of Michigan showed US consumers’ assessments of their current and expected personal financial conditions for the next year both fell by roughly 10%, with concerns over high prices continuing to mount. Conditions for durable goods purchases improved slightly, partly because consumers believed making such purchases now would help avoid price hikes in the future. Due to renewed market worries over high fuel prices and the risk that escalating trade disputes may spill over to the broader economy, consumers’ expectations for short-term business conditions deteriorated sharply. The one-year inflation expectation hit its highest level since June, currently markedly above the 3.4% recorded in February before the Iran conflict erupted and higher than readings in all months of 2024.
At its September policy meeting last week, the Federal Reserve raised the benchmark interest rate by 25 bASIs points to a range of 3.75% to 4.00%, marking its first rate hike in three years. Remarks from multiple officials after the meeting further reinforced tightening expectations. In the US Treasury market, the 10-year Treasury yield hit its highest level since 2007, while the 30-year yield reached a peak not seen since 2004.
On the geopolitical front, Iran put forward a proposal to reopen the strait during the UN General Assembly, causing risk premiums to swing back and forth throughout the week. Last Saturday, Trump rejected the ceasefire proposal from Iran, adding a layer of uncertainty to this week’s geopolitical agenda. Three points need monitoring: whether the US will put forward written conditions, whether Iran will make concessions on nuclear issues, and whether Houthi attacks on Saudi Arabia will escalate further. These three factors will determine whether the suppressed supply premium in international crude oil prices continues to fade or rebounds.
The core sticking point of US-Iran divergence remains the nuclear issue. Trump’s consistent demand is that Iran must never obtain nuclear weapons and restore free passage of the strait. Iran states it will not discuss its nuclear program until its demands are met. The White House stated that US officials are holding active and constructive talks with mediators.
After meeting with the UN Secretary-General in New York, Iranian President Pezeshkian said Iran has not walked away from the negotiating table, yet no longer trusts the US based on past experience. He also indicated Iran still keeps room for further re-engagement.
Trump administration officials stated that Iran misjudges if it believes rising prices and midterm elections will weaken President Trump’s bargaining chips in negotiations to end this nearly seven-month conflict. Although no breakthrough was announced at the conclusion of last week’s talks, the US government remains confident that mounting economic pressure will push Iran toward reaching an agreement.
From September 23 to 25 local time, Chinese President Xi Jinping paid a state visit to the United States. The two heads of state held in-depth exchanges of views on the constructive strategic stable relationship between China and other major international and regional issues, reaching eight consensus outcomes. Among them, the two sides agreed that Iran shall honour its commitment not to develop nuclear weapons and no country or institution may levy tolls on international waterways. China and the US also reached a reciprocal tariff reduction arrangement worth 30 billion US dollars in bilateral trade.
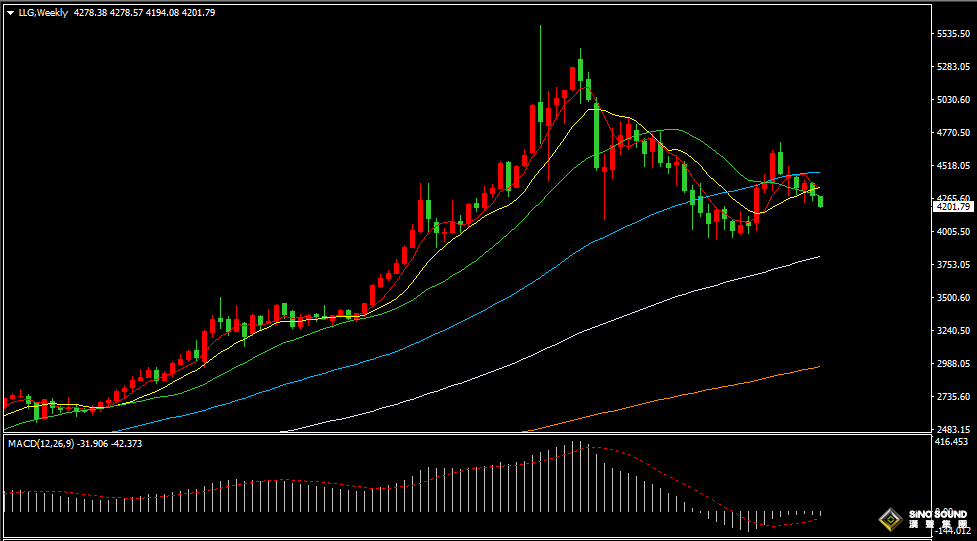
From the weekly gold chart, gold rebounded for three consecutive weeks in August to a peak of $4696.34 per ounce and has since declined peRSIstently. Gold has now broken below the 10-week and 20-week moving averages and is approaching the $4200 threshold. Overall, gold showed a fluctuating downward trend in September. In terms of weekly indicators, the negative momentum histogram of the MACD indicator is gradually expanding, while the RSI indicator slides to around the 44 level.
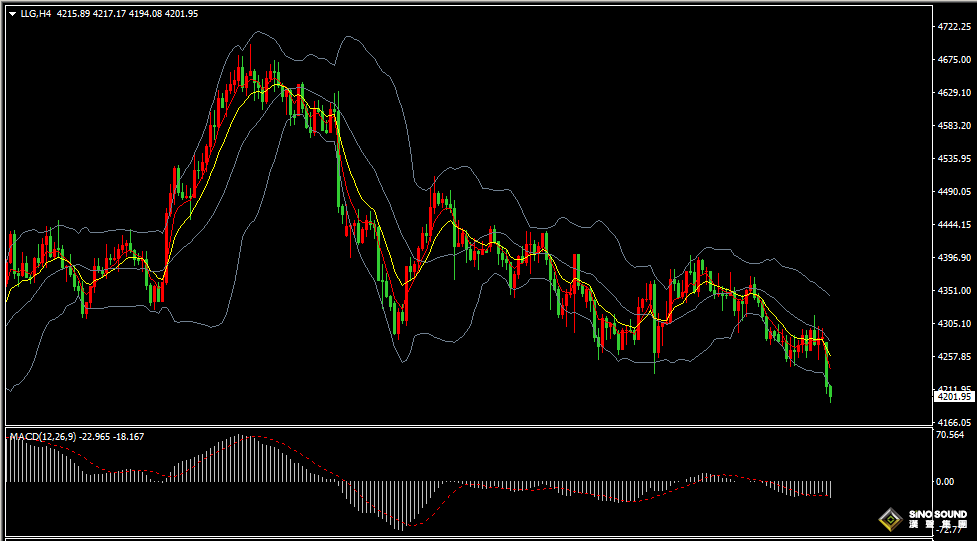
On the 4-hour gold chart, the three BOLLinger Bands continue to trend downward, with gold trading near the lower band. Short-term moving averages EMA5 and EMA10 form a downward bearish pattern. The negative momentum histogram of MACD has expanded, and RSI is moving down close to the oversold level of 30. For short-term trading strategy, watch gold fluctuate and consolidate within the range of $4193-$4255. A breakout to the upside will target $4268-$4278 or near $4285. Downside targets are $4185-$4175 or near $4165.
Key economic data and events to watch today:
TBC ECB President Lagarde delivers testimony
18:00 BoE Deputy Governor Ramsden delivers speech
22:30 US September Dallas Fed Manufacturing Business Index
[Disclaimer]The views and opinions expressed in this article are solely those of the author and do not necessarily reflect the views of SinoSound. SinoSound remains neutral regarding the opinions and statements contained herein and makes no representations or warranties, whether express or implied, regarding the accuracy, reliability, or completeness of the information provided.
The content of this article is intended for informational and reference purposes only. Readers should exercise their own judgment and assume full responsibility for any decisions or actions taken based on the information contained herein.
[Copyright Notice]This article is original content and is protected by applicable copyright laws. Any reproduction, distribution, citation, or use of this content must clearly acknowledge the original source:
Gold2U
www.gold2u.com
We reserve all rights and may take legal action against any individual or entity that fails to comply with this notice or otherwise infringes our intellectual property rights.