

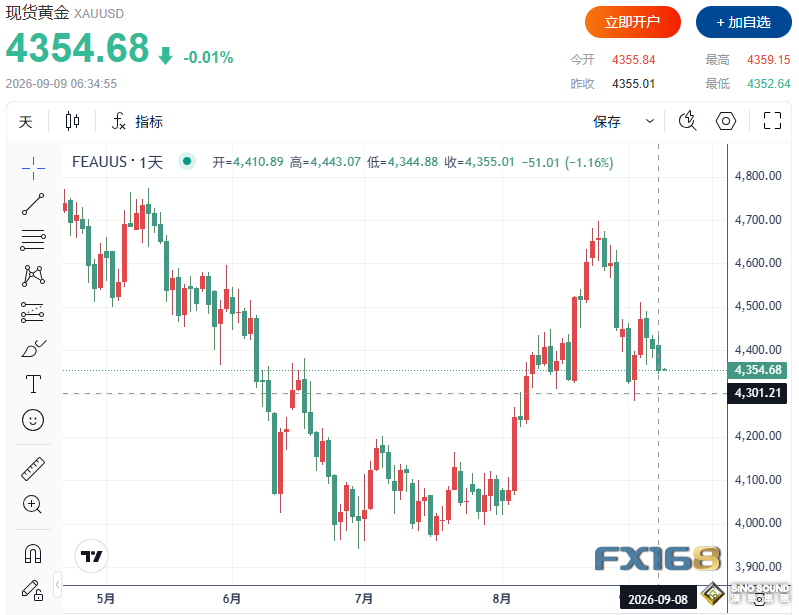
Late Tuesday US session, both spot gold and silver moved lower. Rising crude oil prices, peRSIstently high US Treasury yields and mounting market expectations for Federal Reserve rate hikes offset safe-haven buying triggered by renewed US-Iran tensions. At the close, spot gold settled at $4355.01 per ounce, down $51.01 or 1.816% on the day; spot silver closed at $65.733 per ounce, a drop of 0.61%.
(Source: FX168)
US Stocks Under Pressure, Inflation Fears Rise
North American equity markets closed broadly lower as climbing oil prices reignited inflation concerns. The S&P 500 fell 45.08 points, or 0.6%, to 7673.52. The Dow Jones Industrial Average dropped 628.18 points, or 1.2%, to 52786.07. The Nasdaq Composite shed 85.58 points, or 0.3%, to 26421.41. The Russell 2000 declined 15.44 points, or 0.5%, to 2960.20.
European markets finished mixed. The STOXX Europe 600 edged down 0.05% to 649.60. UK FTSE 100 lost 0.10% to 10811.66. Germany’s DAX was flat at 26007.63. France’s CAC 40 rose 0.14% to 8317.98. Italy’s FTSE MIB fell 0.10% to 52177.47.

Inflation Data and Fed Meeting Take Center Stage
Markets remain focused on this week’s inflation figures and next week’s Federal Reserve policy meeting. Traders currently price in roughly a 60% probability of a rate hike at the September 15–16 meeting. Pricing for higher rates has risen sharply after last week’s strong non-farm payrolls report and the latest oil price shock that keeps inflation risks elevated.
US Producer Price Index (PPI) will be released on Thursday, followed by Consumer Price Index (CPI) on Friday. Traders regard these two releases as the final key inflation inputs ahead of the policy meeting. The 10-year US Treasury yield climbed to around 4.80%, near its highest level since autumn 2023; meanwhile, the US dollar rebounded from earlier weakness. This combination is broadly bearish for gold: a hotter-than-expected PPI or CPI will further validate bets for Fed tightening. Only a marked slowdown in inflation could revive expectations for a pause in rate hikes represented by Waller.
Precious Metals Trade More Like Rate Instruments
The precious metals market continues to be driven largely by interest rates and the US dollar rather than pure safe-haven logic. Gold failed to break the $4422–$4465 resistance zone and retreated toward the $4365 support flagged in the latest technical analysis. Silver remains capped below $67.21 while holding above the $64.73 support, indicating its price is trapped within a gradually narrowing triangle pattern.
This means geopolitical risk is still generating some safe-haven demand, but not enough to offset pressure from inflation, rising oil prices and higher yields. In other words, precious metals are being priced primarily via the “rates‑dollar‑inflation” chain instead of traditional safe-haven buying alone.
Strait of Hormuz Risk Moves Oil Prices
The Strait of Hormuz remains a critical geopolitical chokepoint affecting oil prices, inflation expectations and demand for defensive assets. The latest Iran conflict pushed Brent crude briefly to $99.46 before it pulled back to $97.92. Reports of attacks on Saudi energy infrastructure and peRSIstent shipping risks keep supply hazards in the Gulf elevated.
This waterway is a major pressure point for global energy flows. Goldman Sachs warns that a prolonged disruption could send Brent crude above $120. The scenario has dual implications for gold: on one hand, Hormuz risks support defensive demand; on the other, higher crude prices worsen inflation pressure, lift yields and strengthen the case for another Fed rate hike, weighing on gold prices.
In external markets, Nymex WTI crude strengthened and held in the mid-$90s per barrel; Brent crude settled near $97.92. The benchmark 10-year US Treasury yield stood at roughly 4.80%, and the US Dollar Index was firm. The Kitco Global Index measures the respective contributions of US dollar factors and gold-specific factors to daily gold price moves.
Gold and Silver Technical Levels Overview
Technically, the next objective for spot gold bulls is to reclaim the $4422.00 resistance. A sustained breakout would open the door to $4465.00 and then $4564.00. The near-term bearish target is a break below $4365.00; if this level fails, the next downside target is $4305.00, followed by $4263.00. Current primary resistance sits at $4422.00, then $4465.00; primary support is at $4365.00, then $4305.00.
For spot silver, bulls’ next target is to climb back above $67.21. A break above this level would target $68.74 and $70.76. Bears aim for a drop below $64.73; a breach would push prices further down to $62.57. Current primary resistance is $67.21, then $68.74; next support is $64.73, then $62.57.