

24K99 News: During Friday’s (August 28) ASIan session, spot gold extended its intraday pullback and is currently trading near $4587 per ounce. For this trading day, investors will focus on Fed Chair Warsh’s speech, which is expected to trigger significant market moves. FXStreet chief analyst Valeria Bednarik has published an article analysing gold’s technical outlook.
Bednarik writes that with buying momentum taking a pause, gold’s short‑term bias has turned neutral. Market participants await Fed Chair Kevin Warsh’s appearance on Friday for clues on the future interest‑rate path.
Gold climbed to its highest level since mid‑May earlier this week. The rally was fuelled by renewed market concerns over US‑dollar depreciation. Last week, the US Treasury announced expanded buy‑backs of long‑dated bonds, stoking fears that the dollar’s value could be diluted.
Bob Haberkorn, senior market strategist at StoneX, says traders remain cautious ahead of the highly‑anticipated Jackson Hole Global Central Bank Symposium.

Fed Chair Warsh will deliver a speech at the Jackson Hole Global Central Bank Symposium on Friday. Investors hope that in his maiden Jackson Hole address, the new Fed chair will explain how to bring inflation back toward the Fed’s target and what role he believes the bond market will play in that strategy.
Traders should note that Warsh has long opposed providing forward guidance to markets. Even so, any remarks he makes regarding the economy may offer hints on the future trajectory of interest rates.
According to the CME FedWatch Tool, market expectations for a September Fed rate hike have fallen to 34%, while odds for a rate hike by December remain at 74%.
Gold generates no interest income, so higher interest rates generally diminish its appeal.
Gold Technical Analysis
Bednarik points out that on the 4‑hour chart, gold maintains a mild bullish bias and trades above the 100‑period and 200‑period Simple Moving Averages (SMA) at $4449.40 and $4254.05 per ounce respectively. That said, gold is now consolidating below the 20‑period SMA at $4630.83 per ounce, which acts as near‑term upside resistance. Meanwhile, both the Relative Strength Index (RSI) and momentum indicators hover near neutral levels, suggesting fading upward pressure rather than a full trend reversal.
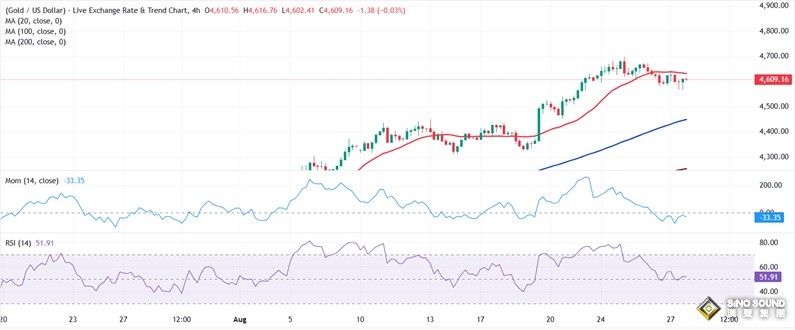
(Spot gold 4‑hour chart, source: FXStreet)
On the daily chart, Bednarik notes gold retains a clear bullish bias, firmly sitting above the 200‑day SMA ($4525.26 per ounce), as well as the 20‑day and 100‑day SMAs ($4390.47 and $4376.46 per ounce), signalling solid underlying support for the uptrend. Momentum indicators stay constructive, with the 14‑period RSI near 67.
Bednarik adds that to the upside, initial resistance lies at the 20‑period SMA around $4630.83 per ounce. A decisive break above this level would open a retest of recent highs. On the downside, the primary key support is the 100‑period SMA at $4449.40 per ounce, with deeper structural support at the 200‑period SMA of $4254.05 per ounce. A drop to that zone would challenge the overall bullish setup.
At 11:11 Beijing time, spot gold trades at $4587.20 per ounce.