

24K99 News‑ On Wednesday (August 26), gold prices tumbled following three consecutive sessions of gains, driven by the latest U.S. PCE inflation figures. FXStreet analyst Christian Borjon Valencia has published an article analysing gold price movements.
Valencia noted that hot U.S. PCE inflation data bolstered expectations for a hawkish Federal Reserve stance, sending gold sharply lower on Wednesday.
Spot gold closed down 1.36% on Wednesday at $4594.68 per ounce.
According to Valencia, the abrupt shift in the gold market was triggered by the release of July’s core Personal Consumption Expenditures (PCE) Price Index, the Fed’s preferred inflation gauge. The reading matched forecasts, holding steady at an annual 3.3%, unchanged from June. Meanwhile, headline July PCE inflation stood at 3.7% year‑on‑year for the second straight month, above the 3.6% consensus estimate.

Prime Terminal data shows market odds of a Federal Reserve rate hike before the end of 2026 have risen, with the probability for a December increase reaching nearly 77%.
In addition, according to the CME FedWatch Tool, traders now assign a 40% chance of a rate hike next month, up from 36% prior to the PCE print.
Gold pays no interest and generally becomes less attractive in a high‑interest‑rate environment.
Geopolitics continue to influence gold prices, Valencia said. Reports indicate Iran and Oman have reached an agreement regarding the Strait of Hormuz and associated revenues. Nevertheless, whether the strait can reopen hinges on Washington’s acceptance of Tehran’s terms; acceptance would pave the way for reopening.
Valencia added that gold is also sensitive to U.S. Treasury yield moves. Expectations for higher rates have pushed bond yields higher. The U.S. Dollar Index (DXY), which tracks the greenback against six major currencies, rose 0.25% to 99.14 on Wednesday, creating headwinds for dollar‑denominated, non‑yielding gold.
Gold Technical Analysis
From a technical perspective, Valencia observed gold is forming a bearish three‑day Evening Star candlestick pattern, with the bearish candle pushing prices below the August 24 intraday low of $4594 per ounce. A daily close beneath this level would open the door for a move toward the 200‑day Simple Moving Average (SMA) near $4378 per ounce.
If that scenario unfolds, subsequent support lies at the August 19 swing low of $4324 per ounce, followed by the $4300 psychological level.
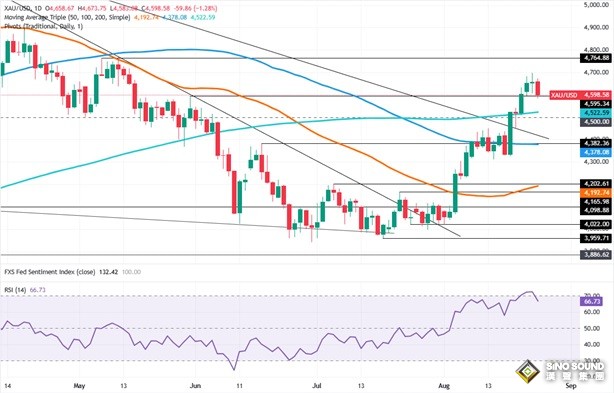
(Spot Gold Daily Chart Source: FXStreet)
On the upside, Valencia stated gold needs to reclaim territory above $4600 per ounce. Should bulls recapture this mark, prices may then target the $4650 and $4700 psychological resistance levels. The next notable overhead zone sits at the May 7 high of $4764 per ounce.