

International gold traded near $4,350 per ounce during Wednesday’s ASIan morning session, down from its early June peak of roughly $4,450. Gold faced heavy selling pressure in the prior session, driven not by fading safe-haven demand, but by a sharp global bond market adjustment. Surging long-term financing costs reduced the relative appeal of non-interest-bearing gold. On August 18, spot gold dipped to around $4,365, marking an intraday decline of approximately 1.1%.
This rise in yields has spread from a single market to global fixed-income markets. The US 30-year Treasury yield briefly touched roughly 5.33%, its highest level since 2007, while the 10-year US Treasury yield climbed to around 4.74%. Meanwhile, Japan’s 10-year government bond yield rose to about 2.95%, a roughly 30-year high, and long-dated yields in Germany and France also stood at multi-year peaks.
Judging by market pricing, the rapid climb in long-end yields does not fully signal renewed bets on aggressive central bank rate hikes. Markets are now more focused on structural factors such as fiscal financing volumes, long-term inflation risks, energy prices and rising global bond supply. In other words, bond markets are demanding higher term premiums, which pressures gold through a mechanism different from the traditional logic that rising real rates weigh on bullion. Even if near-term policy rate expectations do not move noticeably higher, gold may still face portfolio reallocation flows if long-term yields keep advancing.

Energy markets have amplified this complex environment. Crude oil has stayed elevated recently. Brent crude neared $91 per barrel on August 18, and WTI crude rose to roughly $85. Higher energy prices may revive market concerns over future inflation and push bond investors to demand higher yields, creating a transmission chain: rising oil prices → firmer inflation expectations → higher bond yields → near-term pressure on gold.
Nevertheless, gold is not facing only bearish drivers. Recent soft US inflation and retail sales data have significantly cooled market bets on further Fed tightening. Lower rate expectations typically support a weaker US dollar and improve gold’s valuation backdrop. Market pricing for the September policy meeting has shifted from a prior tilt toward a hike to a higher probability of unchanged rates. This means the core debate for gold has evolved from “will rates rise further?” to “how much higher can long-end yields go?”
At the same time, geopolitical risks offer underlying support for gold. Markets are closely watching the operation of energy shipping corridors, with commercial vessel volumes through key maritime lanes remaining low. PeRSIstent supply and transit disruptions could keep oil prices high and add to global inflation pressures. For gold, however, higher oil prices have dual implications: safe-haven and inflation-hedging demand can support bullion, yet if oil pushes up real financing costs and bond yields, gold may face near-term headwinds. Gold’s future path will likely depend on which force dominates.
From a capital-flow perspective, structural shifts are taking place in gold demand. Some institutions argue investors now view gold more directly as an inflation hedge rather than solely an asset positioned for a global eASIng cycle. This means gold can still merit portfolio allocation even with elevated bond yields, as long as investors expect peRSIstent inflation risks. The key risk is a continued rapid rise in real yields without a corresponding pickup in inflation expectations, which would erode gold’s relative holding advantage.
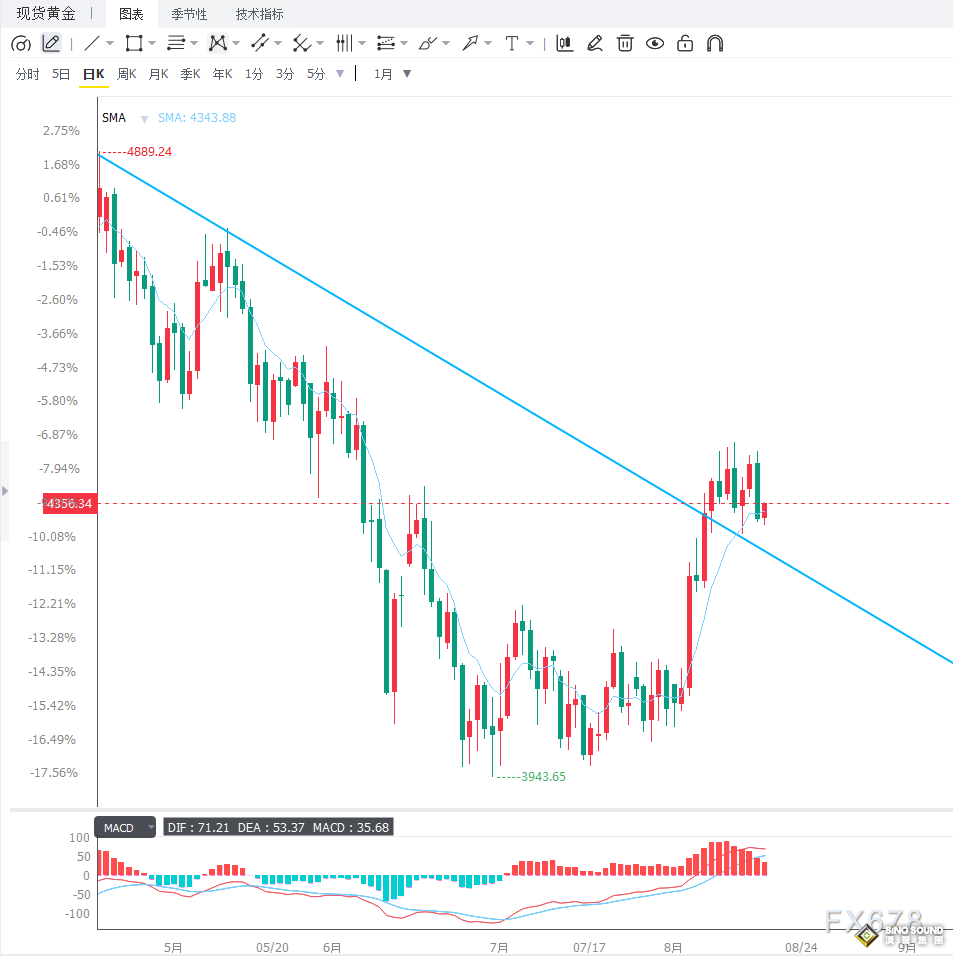
On the technical front, gold’s daily chart remains in a corrective phase after peaking near $4,450 and retesting the zone above $4,300. Near-term bullish momentum has weakened. Prices remain below the 100-day simple moving average around $4,385, confirming the medium-term uptrend has not yet reasserted itself. That said, gold is trading close to the middle band of the 20-day BOLLinger Band, suggesting this is more likely a correction within an uptrend rather than a clear medium-term breakdown. The daily RSI sits near neutral territory, without extreme overbought or oversold conditions.
To the upside, immediate resistance lies near $4,385, coinciding with the 100-day moving average and a pivotal level for confirming whether this correction has concluded. A sustained break above $4,385 followed by a move past $4,450 would reopen upside toward $4,500 and beyond. To the downside, initial support sits around $4,210, near the 20-day BOLLinger mid-band and a critical defensive level for bulls. A daily close below $4,210 could extend the correction toward the lower BOLLinger Band near $3,900–$3,920.
On the 4-hour timeframe, gold shows weak consolidation after a pullback from highs, with prices searching for support around $4,350. Recapturing the $4,380–$4,400 zone would signal eASIng bearish pressure and set up another test of $4,450. Conversely, repeated rejection below $4,380 plus a break of the $4,300 psychological level could extend near-term downside toward $4,250 and then $4,210. Short-term momentum indicators have cooled notably but are not yet in extreme oversold territory, favouring confirmation on key level breaks rather than calling a trend reversal based on a single down day.
Gold is currently caught between three crosscurrents: surging long-end yields, energy-driven inflation risks and softer Fed policy expectations. Near term, the US 30-year Treasury yield near 5.3% acts as strong resistance. Without reclaiming $4,385, gold remains exposed to further downside. Medium term, however, shifting US monetary policy expectations plus peRSIstent inflation and safe-haven demand offer fundamental support. Markets should monitor US real Treasury yields, the US Dollar Index, crude oil prices and Fed communications. A retreat in yields paired with a weaker dollar could reignite gold’s advance, while further yield breakthroughs would deepen corrective pressure on bullion.