

Gold’s upward momentum slowed temporarily on Monday (August 10). Following a dramatic rally last week, some buyers locked in profits, with market focus firmly fixed on the Fed’s interest rate outlook and developments in the Middle East.
As of press time, Spot Gold (XAU/USD) traded near $4,355 per troy ounce, having touched an intraday peak of $4,364.87.
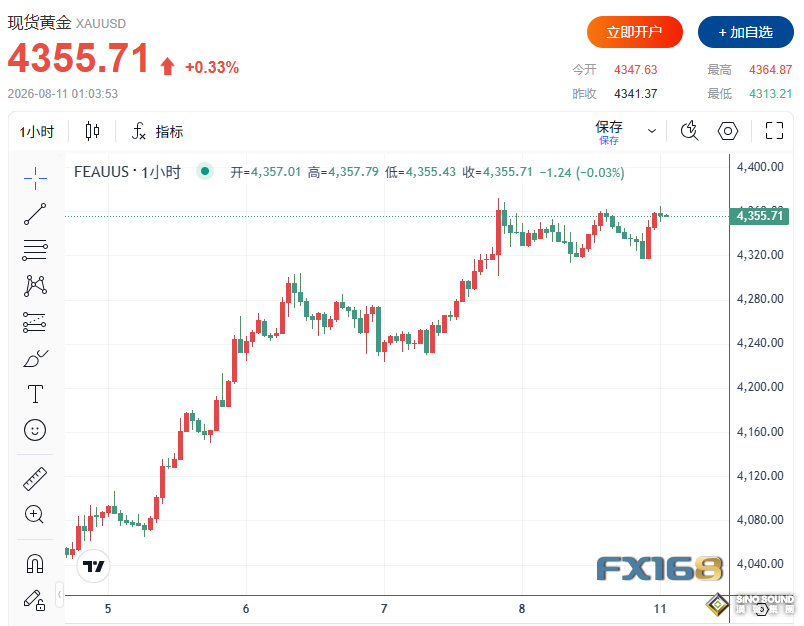
(Image Source: FX168)
Gold climbed more than 7% across last week, hitting its highest level since June 17 last Friday. The softer-than-expected U.S. nonfarm payrolls report prompted the market to sharply downgrade near-term Fed rate hike expectations, serving as the primary catalyst for the bullion rally.
Meanwhile, reports indicated Iran and Oman were closing in on a deal to reopen the Strait of Hormuz, dragging global crude oil prices lower. Fears over energy-driven inflation eased accordingly, putting additional downward pressure on the U.S. Dollar and U.S. Treasury yields.
Nevertheless, oil prices remain markedly above pre-conflict levels, meaning inflation risks have not been fully eliminated and capping the downside for the Dollar and Treasury yields.
The U.S. Dollar Index attempted to stabilize near a two-month low around 99.70, edging up roughly 0.10% on the day. The benchmark 10-year U.S. Treasury yield hovered around 4.67%, down from its recent peak of 4.74%.
Per the CME FedWatch Tool, markets now price a 44% probability of a Fed rate hike at the September FOMC meeting, sharply lower from 67% one week prior.
CPI and PPI to Serve as Next Critical Catalysts for Gold
Investors will turn their full attention to the U.S. Consumer Price Index (CPI) due Wednesday and the Producer Price Index (PPI) releASIng Thursday. These inflation prints will offer fresh clues on the Fed’s policy path and likely dictate the next directional move for the Dollar and gold.
Strategists at Brown Brothers Harriman (BBH) warned the upcoming U.S. inflation data carries downside risks for the U.S. Dollar overall.
The institution explained that a weak CPI reading would reinforce market bets on a dovish Fed policy tilt and renew downward pressure on the greenback. A hotter-than-expected inflation print, by contrast, could trigger a short-lived Dollar rebound amid rising front-end Treasury yields.
BBH also noted that with Fed policy already in restrictive territory, there is limited scope for the market to price in drastically more hawkish outcomes, leaving the Dollar facing lingering headwinds over the medium term.
Lingering Uncertainty in the Middle East Geopolitical Landscape
On the geopolitical front, U.S. President Donald Trump stated Washington was engaged in “semi-negotiations” with Tehran and scaling back military activity. Iranian authorities, however, denied holding direct talks with the United States.
Iranian Foreign Ministry Spokesman Esmaeil Baghaei stressed security in the Strait of Hormuz hinges on the cessation of military operations and compensation for prior attacks.
This means despite market optimism for de-escalation, Middle East risks have not fully abated, leaving oil and gold vulnerable to volatility from breaking headlines.
Technical Analysis: Bullish Gold Structure Intact, $4,389 Marks First Major Resistance
From a technical perspective, gold maintains a constructive bullish overall structure.
Spot Gold is comfortably perched above the 50-day Simple Moving Average (SMA) at $4,150 but remains below the 100-day SMA near $4,389, placing the price in a corrective and upward push phase.
The daily Relative Strength Index (RSI) sits in the mid-60s, signaling solid bullish momentum without entering extreme overbought territory. The Average Directional Index (ADX) stands near the 20 threshold, indicating the prevailing uptrend is gradually strengthening.
On the upside, gold first needs to break and firmly close above the 100-day SMA at $4,389. A decisive breakout would open the door to the next key resistance zone around $4,500.
To the downside, initial support lies at the 50-day SMA level of $4,150, with the critical major support anchored at $4,000. A break below $4,000 would invalidate the current bullish technical setup and potentially trigger a deeper corrective pullback.
All told, gold is likely to trade in a sideways range at elevated levels ahead of the U.S. CPI release. As long as prices hold above $4,150, the medium-term bullish bias remains dominant, with the $4,389–$4,500 zone marking the key breakout zone for the next leg higher.