

On Friday (August 7), the U.S. Dollar and U.S. Treasury yields came under heavy pressure following much-worse-than-expected U.S. nonfarm payrolls data, allowing spot gold (XAU/USD) to extend its powerful recovery rally. Right after the data release, spot gold rallied sharply to hit an intraday peak of $4,371.89 per ounce, its highest level since June 17, representing a $130 jump on the day.
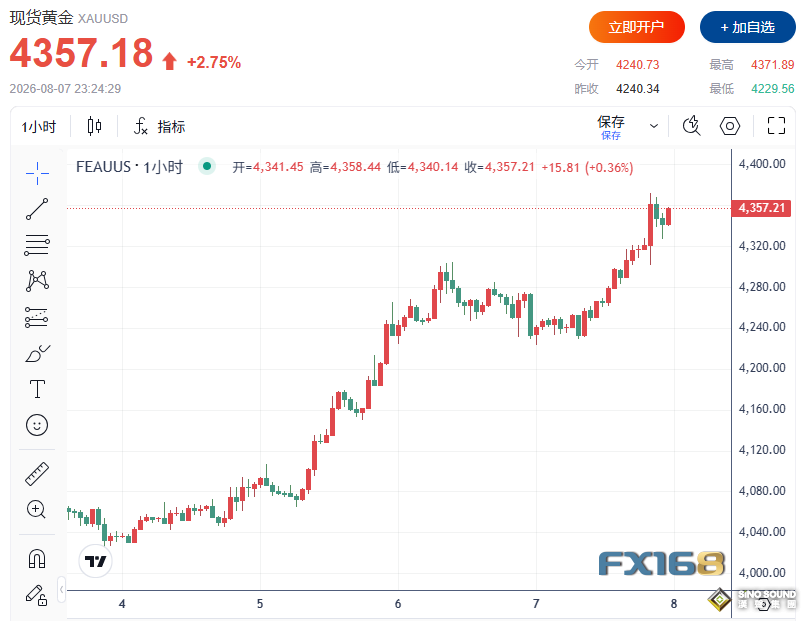
(Source: FX168)
## Disappointing Payrolls Disrupt Fed Hike Path, Dollar and Treasury Yields Slide Lower
Data published by the U.S. Bureau of Labor Statistics on Friday showed U.S. nonfarm payrolls fell by 23,000 in July, sharply missing the broad market consensus forecast of an 80,000 increase. Meanwhile, June’s payroll reading was revised sharply down from the initial 57,000 to just 20,000 new jobs. Though the unemployment rate edged down slightly from 4.2% to 4.1%, broad signs of labor market weakness remained unmistakable.
Hammered by the weak jobs report, the U.S. Dollar Index (DXY) dropped nearly 0.47% intraday, dipping to around 99.45. The benchmark 10-year U.S. Treasury yield retreated to roughly 4.60%, down about 8 bASIs points from its intraday high of 4.68%.
Having broken out of the $4,000–$4,200 sideways range that had held for the past month, gold has gained more than 8% this week, marking its strongest weekly performance since January this year.
## Geopolitics and Inflation Expectations Intertwine, Odds of September Fed Hike Plunge Sharply
Earlier this week, reports that Iran and Oman were closing in on a deal for a proposed new shipping lane through the Strait of Hormuz triggered a notable pullback in crude oil prices, eASIng market fears over energy-driven inflation and prompting traders to scale back bets on aggressive Federal Reserve tightening. The dismal payroll report reinforced this trend: in a lower-rate environment, the appeal of non-yielding gold rises substantially.
According to the CME FedWatch Tool, interest rate futures now price the probability of a rate hike at the Fed’s September policy meeting at approximately 42%, down drastically from around 67% only one week ago.
That said, energy-linked inflation risks have not fully dissipated, with crude oil still pricing in a sizable geopolitical risk premium. Iran’s Fars News Agency reported on Friday that Iran had struck what it described as “hostile targets” in the Strait of Hormuz. In addition, the proposed cooperation between Iran and Oman does not equate to full open access to the strait. Under the framework, Tehran plans to collect transit fees and is reviewing legislation to ban vessels from adversarial nations including the U.S. and Israel from navigating the waterway.
## Technical Analysis: Daily Chart Shows Strong Bullish Momentum, Watch 100-Day MA for Upside Resistance
On the daily timeframe, XAU/USD has rebounded firmly above the 20-period SMA of the BOLLinger Bands (located at $4,086) and is now comfortably perched above the upper BOLLinger Band at $4,272, underscoring robust underlying buying demand following the prolonged range-bound consolidation.
Indicator readings: The daily RSI stands at 66, edging closer to the overbought zone. The MACD histogram maintains a strong positive reading, confirming sustained bullish momentum.
Upside resistance: The primary critical resistance level lies at the 100-day moving average near $4,390. A decisive breakout and daily close above this threshold will unlock clearer room for further upside.
Downside support: Immediate near-term support sits at the upper BOLLinger Band of $4,272, followed by the middle BOLLinger Band at $4,086, with solid major support anchored at the psychological $4,000 round number.