

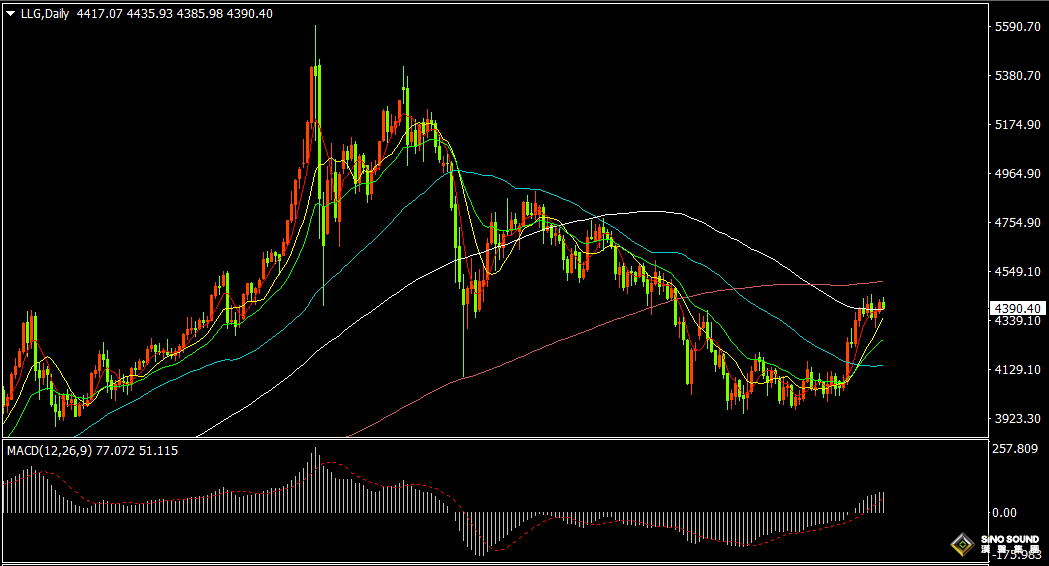
During Tuesday’s ASIan session, spot gold opened at $4417.07 per ounce. After surging briefly to $4435.93 per ounce in early trading, gold pulled back and hit an intraday low of $4385.98 per ounce in the afternoon. At press time, gold is trading near $4391 per ounce, down roughly 0.58% on the day.
The US Dollar Index rebounded intraday to a high of 99.69 and is now quoted at 99.66, up 0.07%. The 2‑year US Treasury yield rose 1.3 bASIs points to 4.191%; the 10‑year US Treasury yield climbed 2.5 bASIs points to 4.746%.
The two major international crude oil benchmarks edged higher. WTI crude is quoted at $84.42 per barrel, up 0.37%; Brent crude stands at $91.34 per barrel, gaining 0.28%. US Natural Gas CFD is at $2.735 per million British thermal units, down 0.182%.
Turning to equities, China’s A‑share main indices opened lower and drifted down before bouncing in the afternoon. By market close, combined turnover on the Shanghai and Shenzhen bourses reached RMB 2.4 trillion, an increase of more than RMB 13.3 billion versus the previous session. More than 3,200 stocks across the market closed lower. The Shanghai Composite Index rose 7.65 points, or 0.19%, to 3990.3. The Shenzhen Component Index fell 81.78 points, or 0.56%, to 14622.5. The ChiNext Index dropped 34.59 points, or 0.92%, to 3705.56.
Hong Kong equities drifted lower in the morning and recovered in afternoon trade. Total turnover for the Hang Seng Index reached HK$255.541 billion at close. The Hang Seng Index gained 17.92 points, or 0.07%, to 25471.15. The Hang Seng Tech Index shed 42.85 points, or 0.9%, to 4739.18. The Hang Seng China Enterprises Index added 13.23 points, or 0.16%, to 8453.2. The Hang Seng China Red Chip Index rose 21.56 points, or 0.52%, to 4183.04.
European equity indices opened in the afternoon: FTSE 100 opened 0.05% higher; Euro Stoxx 50 opened 0.27% lower; Spain’s IBEX 35 opened 0.06% higher; Italy’s FTSE MIB opened 0.21% lower; Germany’s DAX 30 opened 0.34% lower; France’s CAC 40 opened 0.20% lower.
In afternoon trade, Shanghai Gold Exchange’s Gold(T+D) closed 0.37% higher at RMB 955.07 per gram, while Silver(T+D) closed 0.64% lower at RMB 15899.0 per kilogram.
Freshly‑released UK data showed the July unemployment rate stood at 4.33%, versus the prior reading of 4.40%. July claimant count fell by 11,000; the prior figure was revised from 6,700 to ‑6,400. The three‑month ILO unemployment rate for June was 4.9%, against market expectations of 4.8% and matching the previous reading of 4.90%.
UK unemployment came in below the 4.8% market consensus, while employment levels declined over the three‑month period ending June. The UK labour market has been gradually loosening for some time, supporting the case for the Bank of England to keep interest rates unchanged at 3.75% for the rest of the year.
Euro‑zone government‑bond yields climbed to multi‑year highs amid a global fixed‑income sell‑off. Germany’s 10‑year bund yield hit 3.2478%, the highest level since May 2011. France’s 10‑year OAT yield rose to 4.0954%, a peak not seen since November 2008. Markets worry that if the Iran conflict drags on, governments may need higher spending to cushion economic fallout from Middle‑East energy‑supply disruptions. Meanwhile, deteriorating geopolitics are pushing up military outlays, further stoking market concerns over fiscal positions.
Turmoil has returned to the US Treasury market. Expectations of a USD 2‑trillion deficit lift government financing pressures. Bond issuance by AI‑focused corporates is siphoning capital away, and inflation remains above target. Long‑dated US Treasuries are facing multiple headwinds.
The US long‑term Treasury market is under renewed selling pressure. The 30‑year Treasury yield jumped nearly 6 bASIs points yesterday to 5.31%, breaking its July high and hitting its highest mark since 2007.
According to an official from the World Gold Council China, LBMA and Shanghai gold benchmark prices remained broadly steady in July with minimal overall volatility. Gold‑return‑attribution data show that month‑on‑month USD weakness and improved investor positioning provided positive support, effectively offsetting bearish pressure from rising US Treasury yields and keeping gold range‑bound.
Turning to Middle‑East developments: foreign‑media reports cite officials from Yemen’s internationally‑recognised government stating that Iran‑backed Houthi forces have recently stepped‑up missile and drone strikes against Red‑Sea coastal targets, forcing the strategic port of Mokha to suspend operations and extending hostilities toward the Bab el‑Mandeb Strait. This strait is a critical global shipping chokepoint and a key alternative route for Saudi oil to bypass the Strait of Hormuz.
Iranian Foreign Minister Araghchi commented: “As you can see, the enemy begged for negotiations shortly after hostilities broke out. We rejected cease‑fire proposals and insisted on fighting until they finally accepted a cease‑fire and talks on Iran’s terms.”
On the daily chart, gold failed to extend its two‑day rally and pulled back to consolidate below the $4400 psychological level, trading within the past week’s range. Daily indicators show gold is consolidating near the intersection of the 5‑day and 100‑day moving averages. The MACD positive histogram remains sustained, while the RSI hovers around the 63 level.
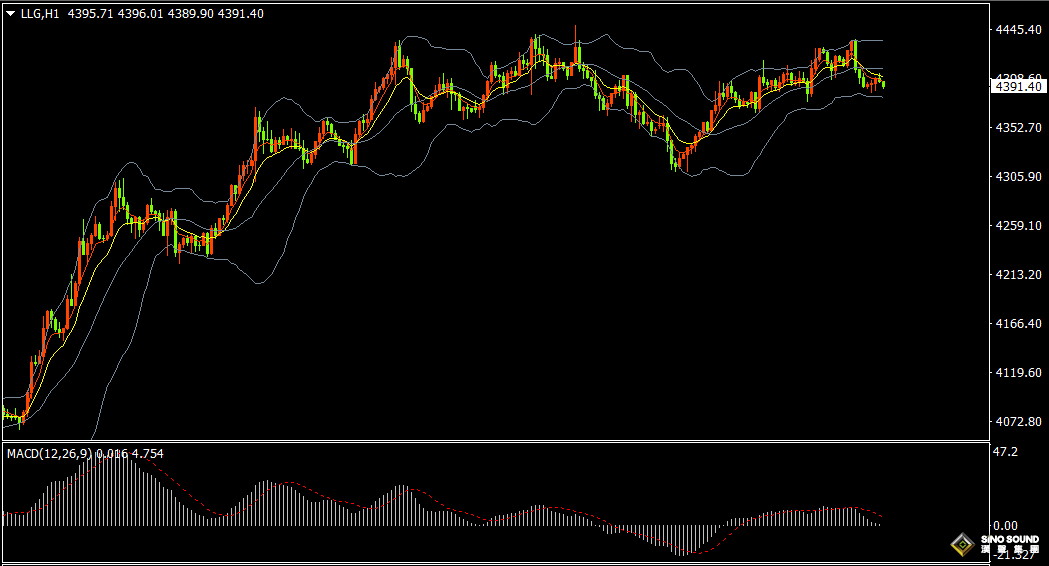
On the 1‑hour chart, gold is consolidating between the middle and lower BOLLinger Bands. Short‑term EMA5 and EMA10 have formed a bearish alignment. The MACD positive histogram has shrunk toward the zero line, and the RSI hovers near 45. For tonight’s short‑term trading outlook, expect consolidation within the $4360‑$4435 range. A breakout to the upside would target $4445‑$4450 or near $4465. A downside breakout would target $4350‑$4335 or near $4320.
Key economic data and events to watch tonight:
20:15 US Weekly Change in ADP Employment for the week ending August 1
20:30 US Annualized Total New‑Home Starts (July)
20:30 US Total Building Permits (July)
20:30 US Monthly Import Price Index (July)
21:15 US Monthly Industrial Output (July)
22:00 US Monthly Pending Home‑Sales Index (July)
04:30 (Next Day) US API Weekly Crude‑Oil Inventories for the week ending August 14
[Disclaimer]The views and opinions expressed in this article are solely those of the author and do not necessarily reflect the views of SinoSound. SinoSound remains neutral regarding the opinions and statements contained herein and makes no representations or warranties, whether express or implied, regarding the accuracy, reliability, or completeness of the information provided.
The content of this article is intended for informational and reference purposes only. Readers should exercise their own judgment and assume full responsibility for any decisions or actions taken based on the information contained herein.
[Copyright Notice]This article is original content and is protected by applicable copyright laws. Any reproduction, distribution, citation, or use of this content must clearly acknowledge the original source:
Gold2U
www.gold2u.com
We reserve all rights and may take legal action against any individual or entity that fails to comply with this notice or otherwise infringes our intellectual property rights.