

During early‑Thursday US trading hours, spot gold and silver climbed sharply. Spot gold hit an intraday peak of $4540.93 per troy ounce, up roughly 0.3%; spot silver reached $68.983, gaining nearly 3%.
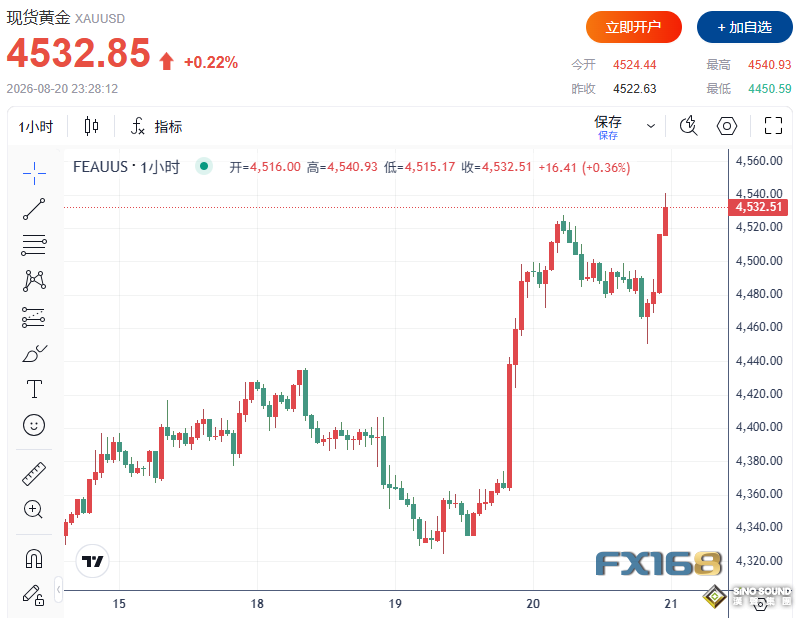
(Image source: FX168)
Gold once rallied more than 4% on Wednesday, after the US Treasury announced it would expand liquidity‑supporting repurchase operations for long‑dated Treasury bonds, driving a notable drop in US Treasury yields and a weaker US dollar. However heading into Thursday, better‑than‑expected US initial jobless‑claims data triggered a rebound in Treasury yields and the US dollar, pulling gold back from its more‑than‑two‑month high.
US Treasury Steps In, Gold Spikes Over 4% At One Point

On Wednesday, the US Treasury announced increases in liquidity‑support repurchases for long‑term government bonds. Following the release, the 30‑year Treasury yield fell around 9 bASIs points to 5.18%, while the benchmark 10‑year Treasury yield dropped roughly 5 bASIs points to 4.63%.
This measure temporarily eased heavy pressure weighing on the bond market recently. Earlier this week, the 30‑year Treasury yield briefly broke above 5.30%, hitting its highest level since 2007.
Driven by the rapid pullback in Treasury yields, non‑yielding gold became substantially more attractive, sending gold prices surging more than 4% at one stage on Wednesday.
Meanwhile, the US dollar faced heavy selling pressure. The US Dollar Index broke below 99 on Wednesday, hitting a three‑month low. As of Thursday intraday, the US Dollar Index stood near 98.80, bouncing off its intraday low of 98.56.
Nevertheless, analysts warn that Treasury repurchases can only ease bond‑market liquidity pressure in the short run. They cannot fundamentally resolve America’s huge fiscal deficit, massive Treasury issuance scale, and peRSIstent inflation risks.
Solid Employment Data Fuels Rebound in US Dollar and Treasury Yields
Market sentiment began shifting on Thursday.
Fresh US labour‑market figures showed initial jobless claims for the prior week fell to 206,000, below market expectations of 210,000 and the prior reading of 212,000.
Better‑than‑expected employment data lent support to the US dollar and pushed Treasury yields higher once again.
On Thursday, both 10‑year and 30‑year Treasury yields rebounded around 6 bASIs points. The concurrent rise in the dollar and yields diminished the appeal of non‑yielding gold and pulled prices down from their multi‑month high.
Fed Rate‑Hike Expectations Remain Gold’s Biggest Constraint
Gold’s subsequent trajectory remains highly dependent on Federal Reserve policy expectations.
Analysts at TD Securities stated that signals of Treasury support for long‑dated bonds, alongside a potential Fed inclination to downplay short‑term inflation driven by energy costs, should offer near‑term support for gold.
Still, the institution warns that gold’s next truly sustained rally may have to wait.
The key reason is markets are still pricing in potential Fed rate hikes in 2027. Until investors grow more confident that the Fed will keep rates unchanged for an extended period, gold’s scope for further sharp advances may be limited.
According to the CME FedWatch Tool, markets currently assign roughly a 65% probability that the Fed holds rates steady in September, markedly higher than the 35% probability one month ago.
The Fed’s July meeting minutes, published Wednesday, also delivered hawkish signals. Multiple officials argued higher interest rates may be required in future if inflation fails to keep falling. Some officials even questioned whether current financial conditions are sufficiently restrictive to return inflation to the Fed’s 2% target.
Technical Outlook: Gold Stalled at the 200‑Day Moving Average
On the daily chart, gold retains a near‑term bullish bias.
Prices are still trading above the 50‑day and 100‑day moving averages, situated near $4164 and $4380 per ounce respectively.
Gold previously broke above the 200‑day moving average yet has drifted back toward $4512, marking this level as a key battleground between bulls and bears.
Among technical indicators, the Relative Strength Index (RSI) stands around 65, and MACD histogram bars remain in positive territory, indicating upward momentum has not fully faded.
A firm daily close above the 200‑day moving average would target next resistance near $4650 per ounce.
On the downside, the 100‑day moving average at $4380 represents the first major support. A break below that would open a move toward the 50‑day moving average at $4164, followed by the psychological $4000 level.
All told, the US Treasury’s expanded long‑bond repurchases acted as an important catalyst for gold’s breakout. However strong US employment data and resurgent Treasury yields are quickly eroding that positive impulse. Whether gold can re‑establish itself above $4500 and clear the 200‑day moving average will be critical for unlocking further upside in the next phase.